View User Dashboard
The User dashboard displays endpoint activity for a single endpoint, offering end-to-end visibility for efficient troubleshooting and issue diagnosis.
Prerequisites
- The ThousandEyes agent must be registered on the end user machine with the account group that is linked to your Experience Insights integration. Registration occurred during onboarding with Experience Insights.
- To register agents that were added after onboarding, see: Configure Experience Insights.
Procedure
- Navigate to: Experience Insights > Insights Management > Management.
- On the Endpoints summary page, scroll down to the user table and click a username.
Result: The User dashboard displays.
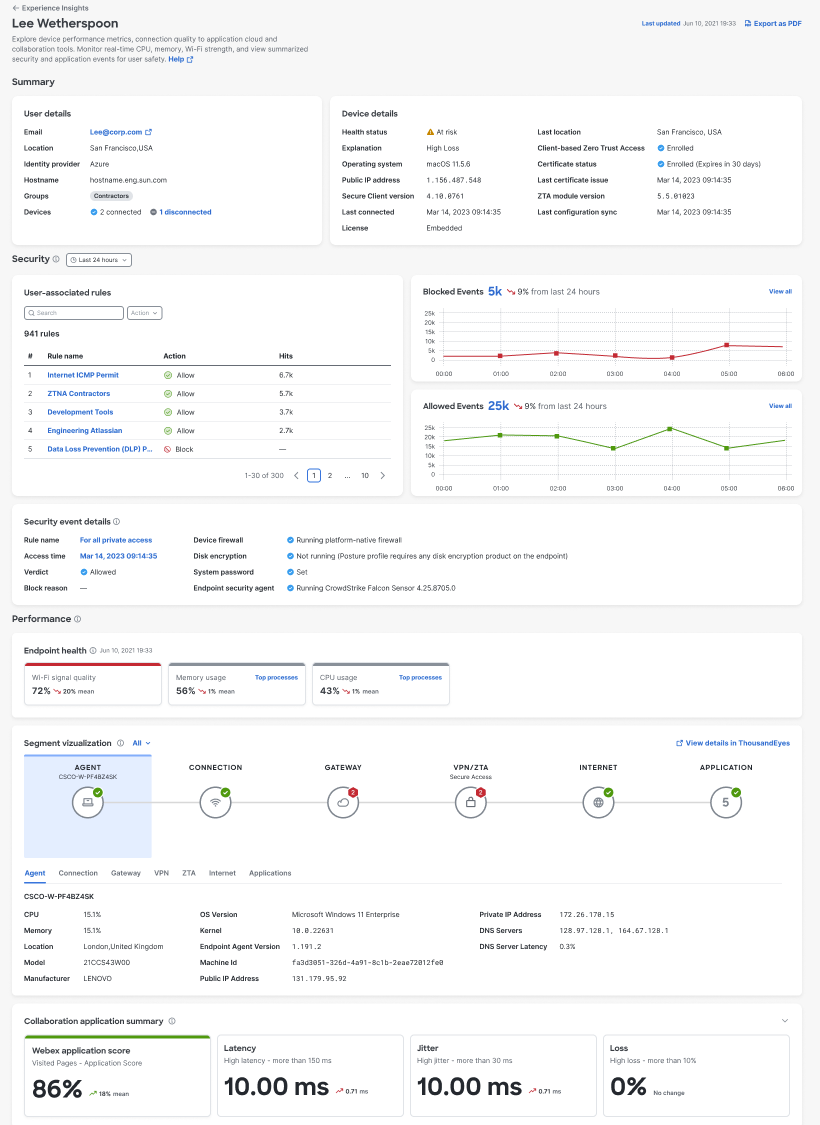
User Details and Device Details
View high-level information about the user and their devices that have the ThousandEyes agent installed and registered with Secure Access.

Endpoint health
Gain insights into key device metrics, including Wi-Fi, CPU usage, and memory usage, to understand their impact on performance.

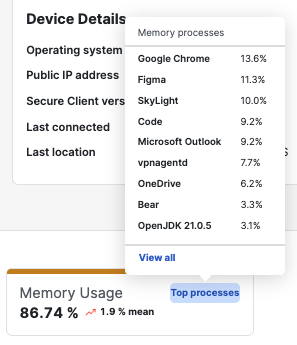
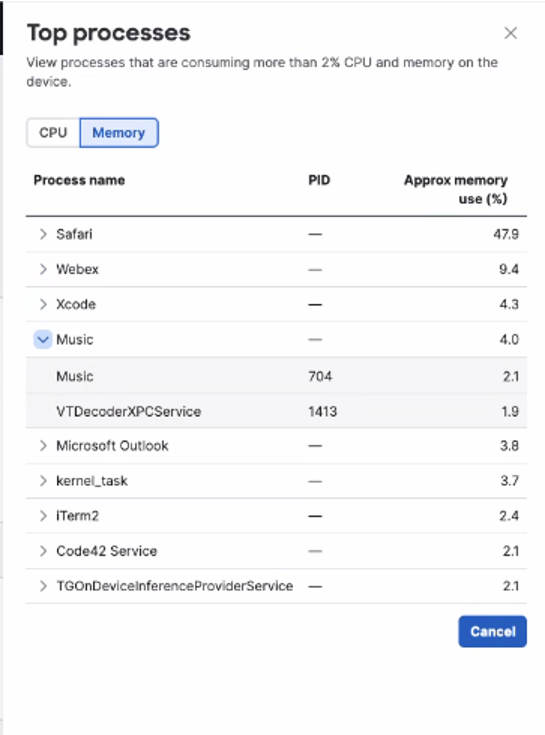
To view the top processes that are consuming more than 2 percent of CPU and memory on user devices, click Top processes. To drill down into the specific processes, including process IDs, click View all.
In the Top processes window, click a process to drill down into each running process.
Security Events
- To see data in the Security Events section, the following must be installed on the end user's machine:
- Cisco Secure Client. For information, see Download Cisco Secure Client.
- ThousandEyes. For information, see Set Up Experience Insights.
- Zero Trust Access. For information, see Add a Client-Based Zero Trust Access Posture Profile.
The section displays the allowed and blocked events that occurred when a user's device attempted to access an organizational resource using Zero Trust Access.
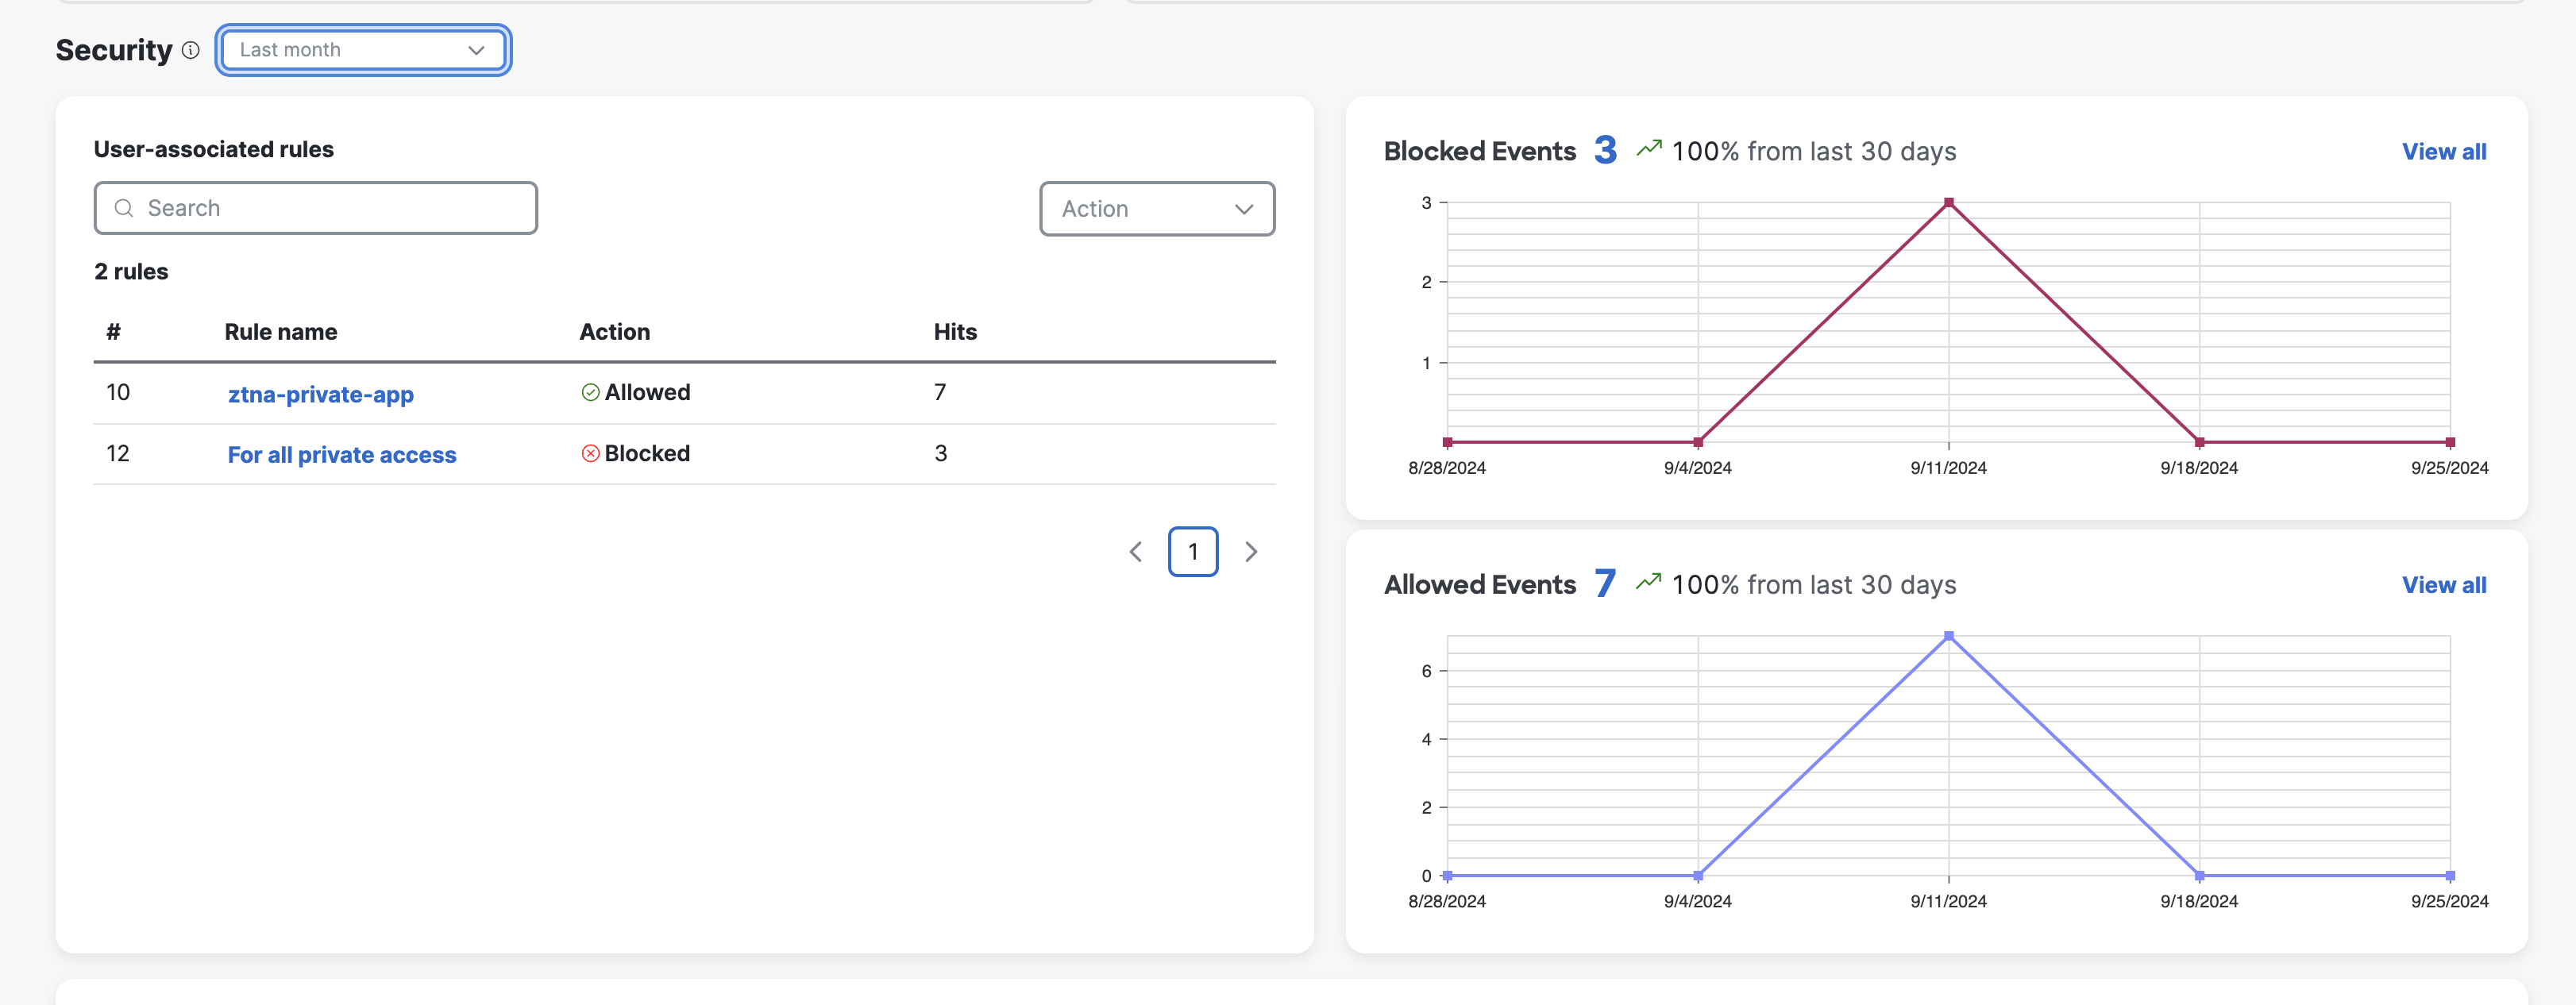
The User-associated rules section displays the Zero Trust Access security rules that were triggered by the user's device in a specified period, sorted by descending order of frequency.
- When an event is both allowed and blocked, its user-associated rule displays as two separate entries in the table.
The Blocked and Allowed Events graphs display the combined total of blocked and allowed Zero Trust Access events for the user's device within the specified time period.
- To see a comprehensive view of events that are associated with the user, click View all .
The Security event details section shows information for the security event that was triggered for the user's device most recent attempt to access an organizational resource using Zero Trust Access. For more information, see Client-Based Zero Trust Access.

Segment Visualization
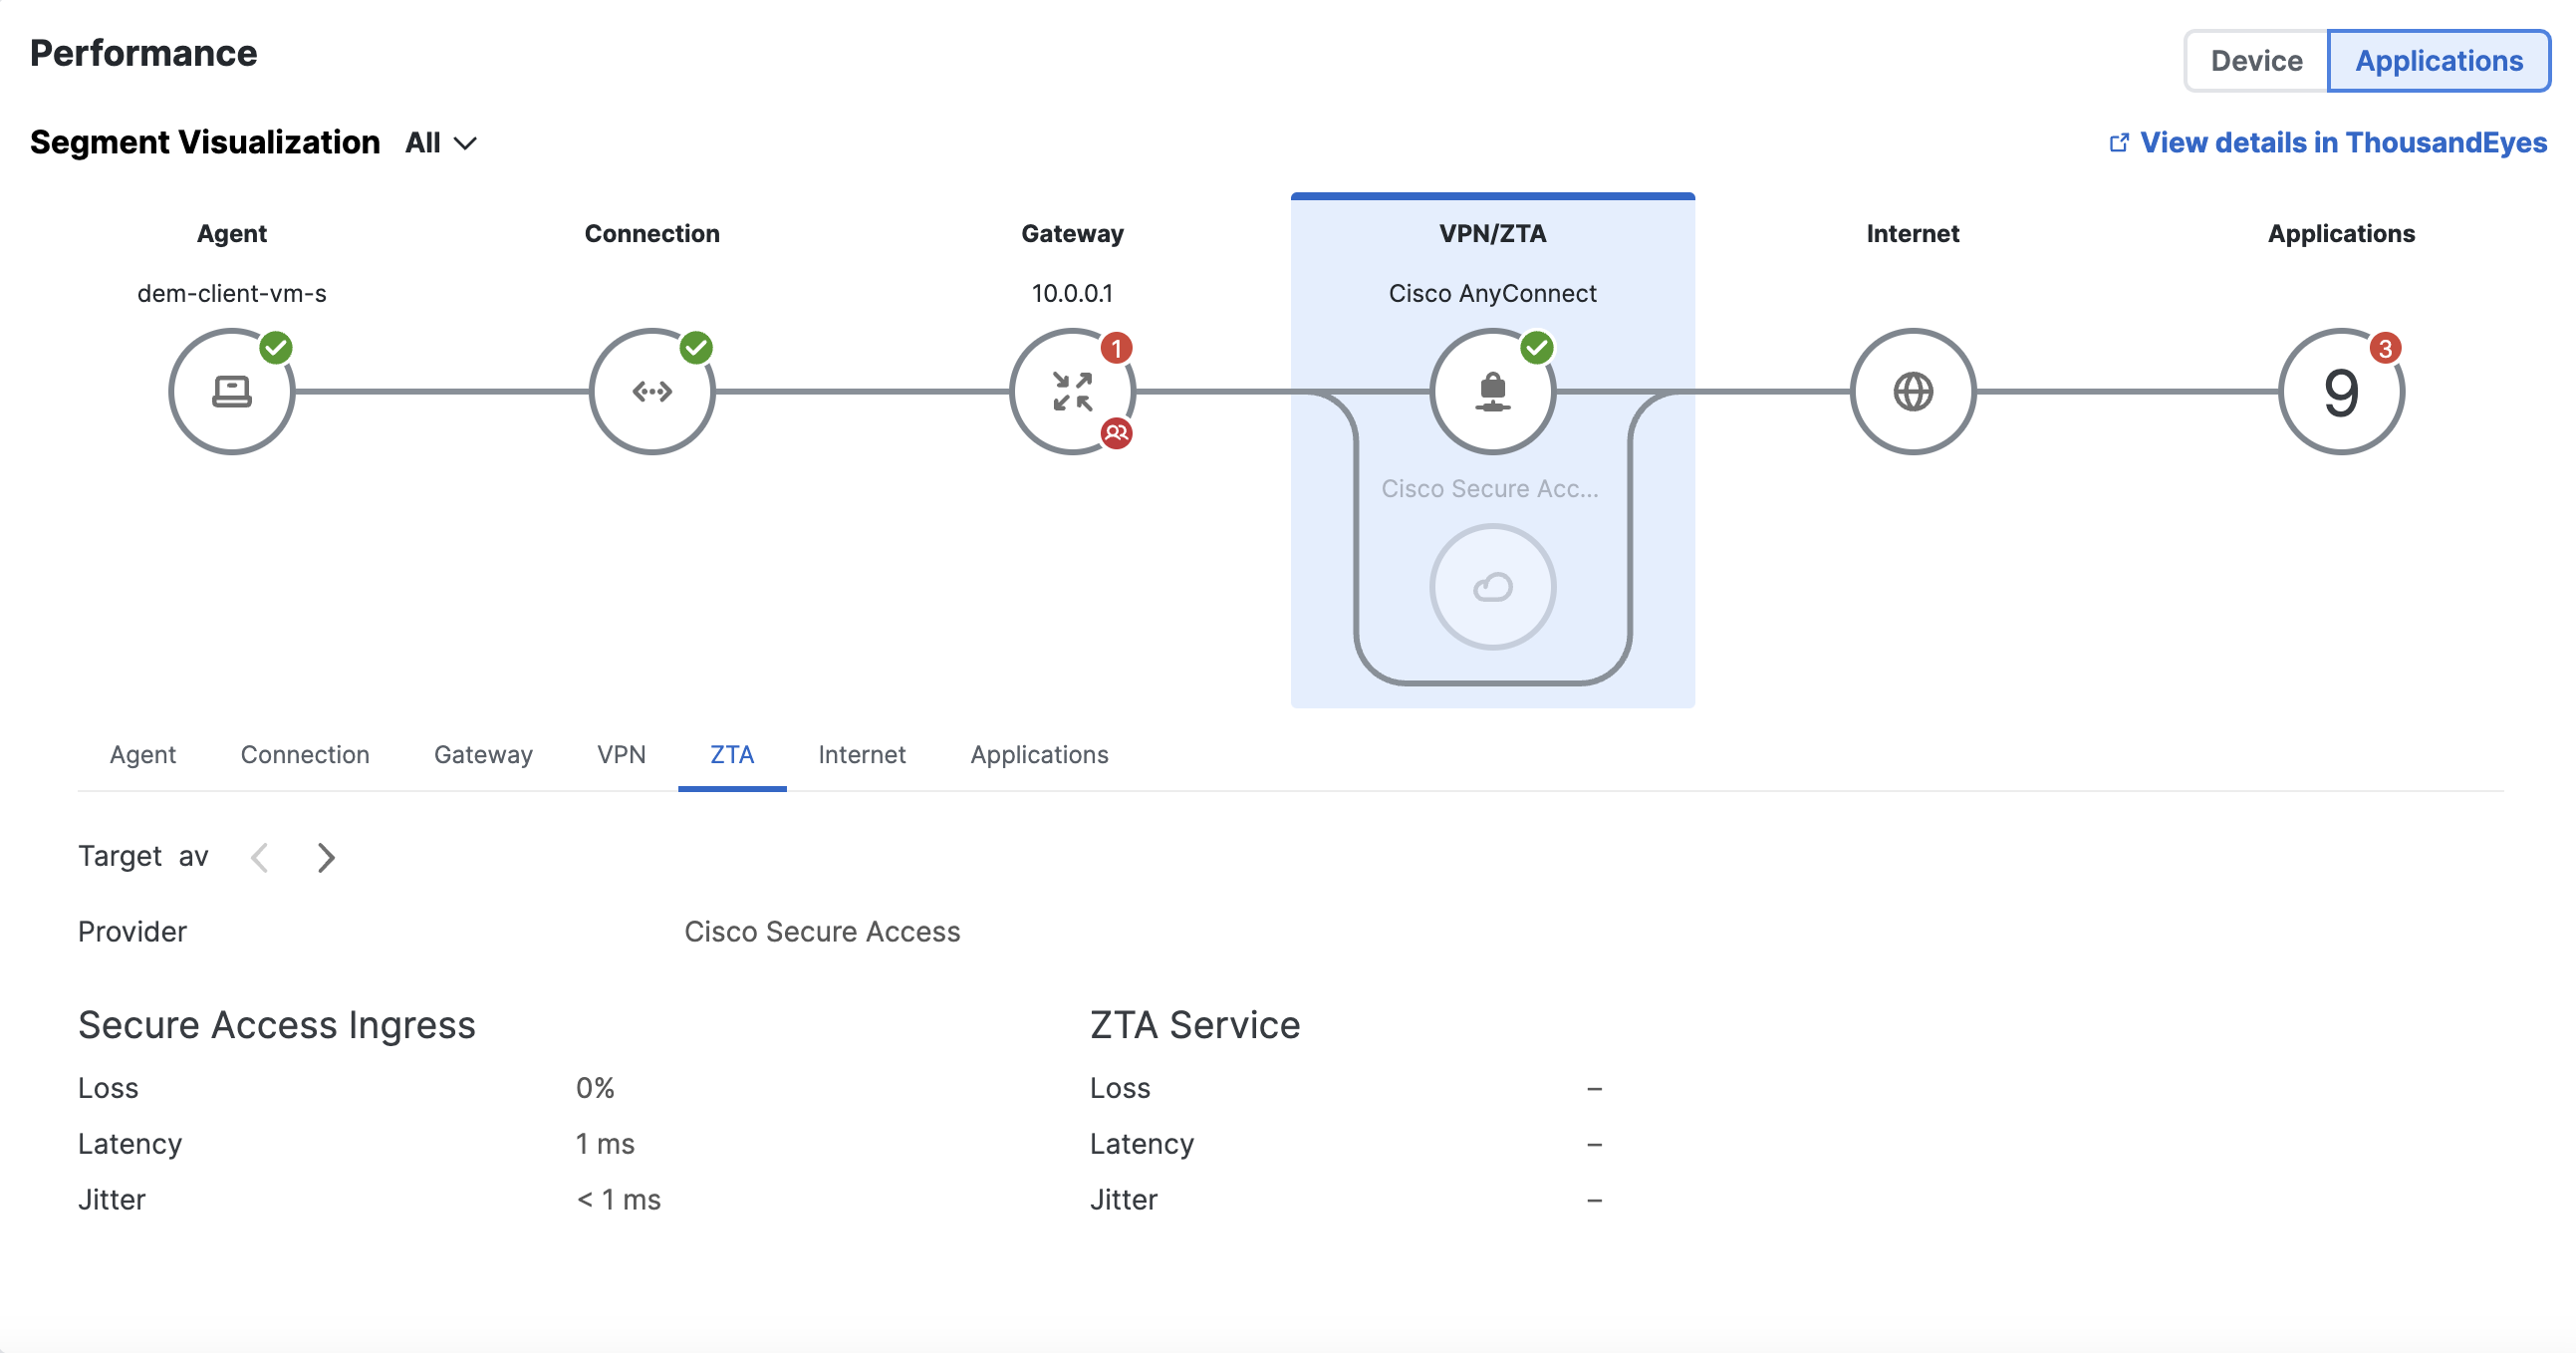
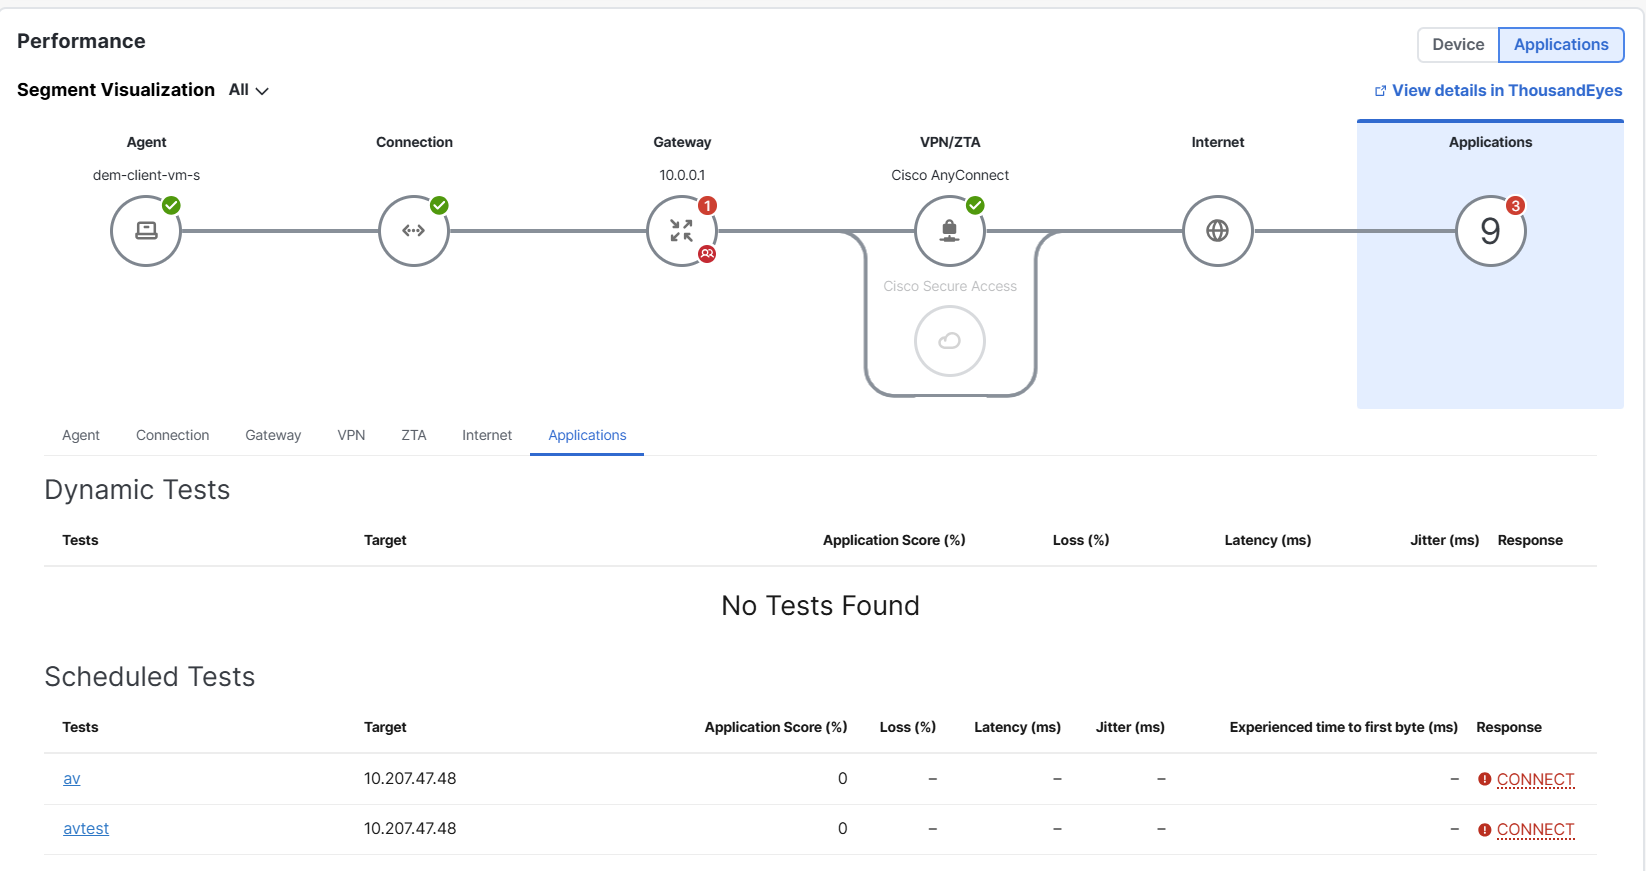
The view provides a look at the entire network journey, starting from the agent and ending at the destination, so that you can pinpoint the specific segment that is causing performance degradation. Each segment provides detailed information to troubleshoot underlying network issues.
- Your ThousandEyes license allows for one scheduled test and one dynamic test. Upgrading your license allows for additional tests. For more information about ThousandEyes licenses, see About Endpoint Agent Tests.
By default, the view covers all tests running on the agent. To filter results by test, use the drop-down menu in the top left corner.
To display the view, click the Applications button.

Segment details
- Agent—Score is calculated using CPU and memory.

-
Gateway—Score is derived from local network tests to the gateway based on loss, latency, and jitter values.
-

VPN—Score is derived from the local network tests of the VPN that are computed using network metrics including loss, latency, and jitter.
-

ZTA—Shows performance metrics (loss, latency and jitter) to the Secure Access ingress, which represents the unencrypted path over the internet from the client to the ZTA proxy load balancer. Also view performance metrics to the ZTA service, which represents the encrypted path towards the service.
- Internet—Shows the IP addresses that the device data passes through and the delay (similar to how traceroute works).

- Application—Score reflects the overall performance of the scheduled or dynamic test that is running for an application. Calculated using loss, latency, jitter, and overall HTTP availability and response time.
Collaboration Application Summary
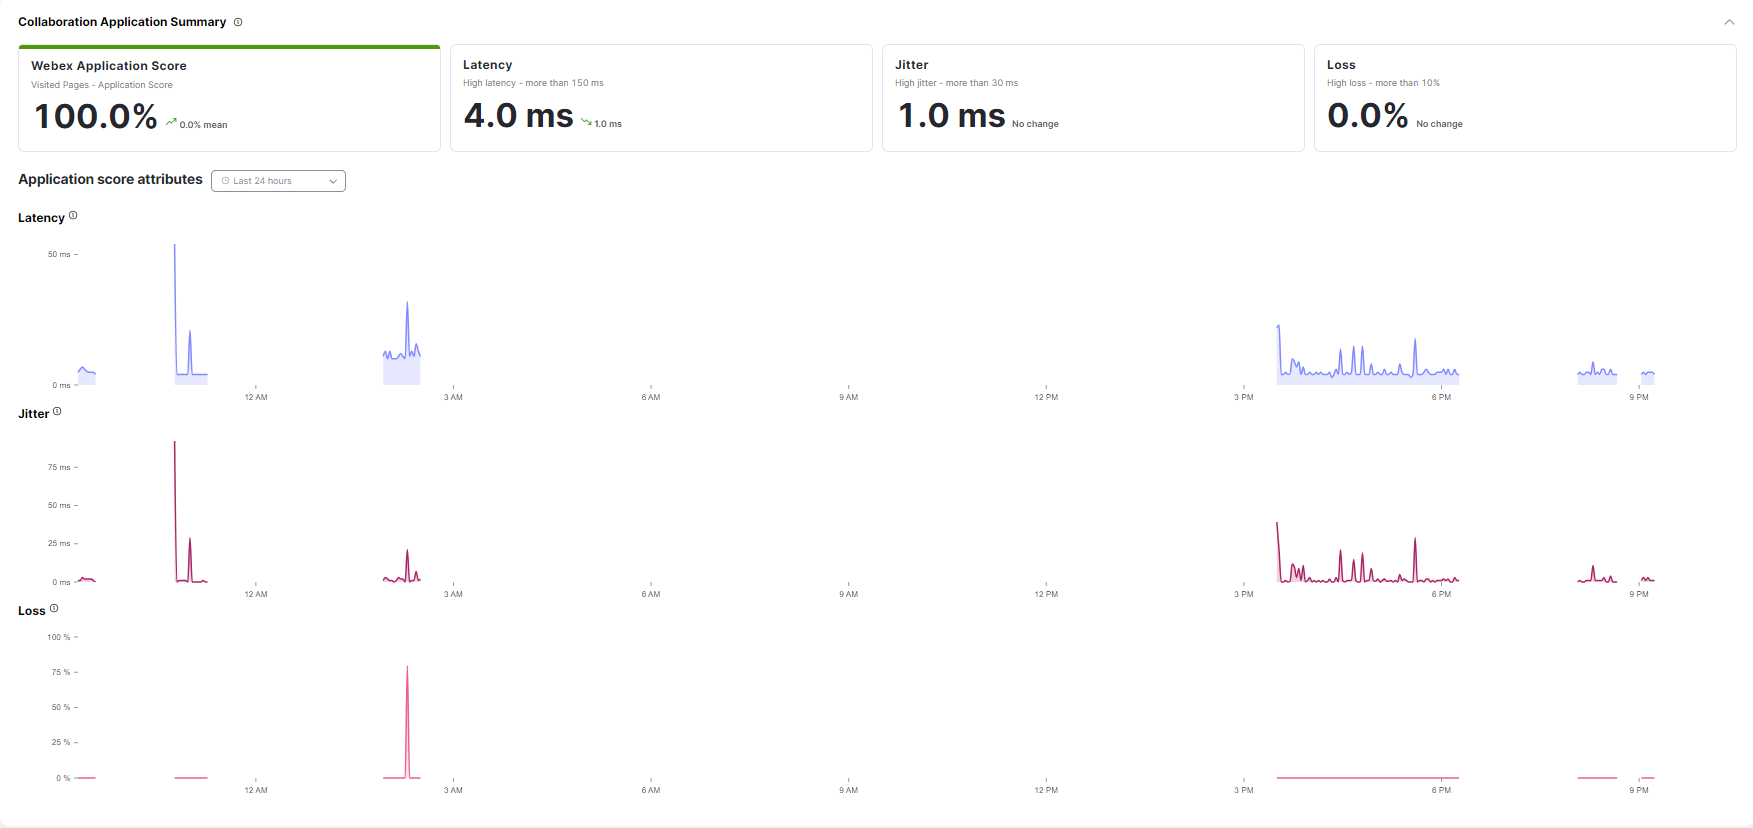
View a real-time summary of the collaboration application's performance including latency, jitter, and packet loss that may impact the user's interactions with the application. Drill down into the data and interactive graphs from the last four days to help ensure a seamless digital experience and maximize workforce efficiency for the user.
Tip: Compare the data to the user’s previous experiences to identify anomalies.
View Common SaaS Applications < View User Dashboard > About Endpoint Agent Tests
Updated 14 days ago
