View Endpoint Performance Map
The Endpoint Performance map is a visual representation of all endpoints that have been installed and registered to your ThousandEyes account. For instructions on how to install and register your endpoints, see Configure Experience Insights.
The map provides real-time insights into the geographic distribution and health status of the endpoints. An endpoint's status is determined based on VPN network performance and endpoint metrics including memory, CPU, and Wi-Fi signal.
Being able to continuously monitor the health status of endpoints can serve as a starting point to investigate issues. For example, if a specific endpoint is continuously unhealthy, you may want to examine the endpoint's hardware and network connection for issues. Or if all endpoints in a region are unhealthy, a service outage might be the cause.
Procedure
Navigate to Experience Insights > Insights Management > Management.
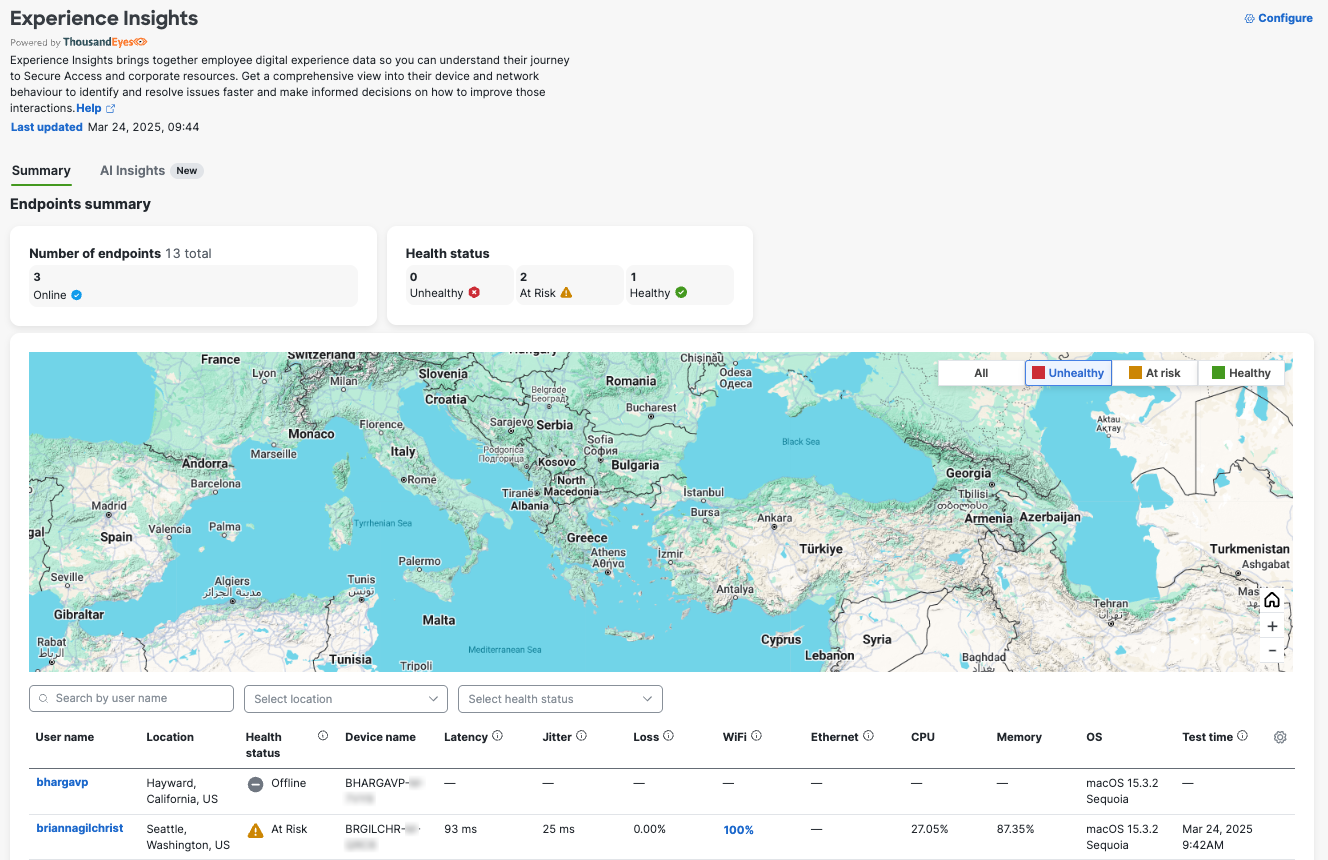
- Filter endpoints by health status, click the button (All, Unhealthy, At risk, Healthy). By default, the map displays unhealthy endpoints. If any endpoint in a location is unhealthy, its location marker is red.
- Hover over a location marker to view the number of healthy, at risk, and unhealthy endpoints for that location.
- To zoom in and out, use the plus and minus buttons. To reset the map view, click Go Home .
- Click a number on the map to see the concentration of endpoints for an area. Continue to zoom in on the map until you reach the exact endpoint location.

Configure Experience Insights < View Endpoint Performance Map > View Summary of Endpoints
Updated 3 months ago