View Summary of Endpoints
View a real-time summary of the health of your endpoints for faster troubleshooting and to take action to deliver a better, more secure experience for your end users.
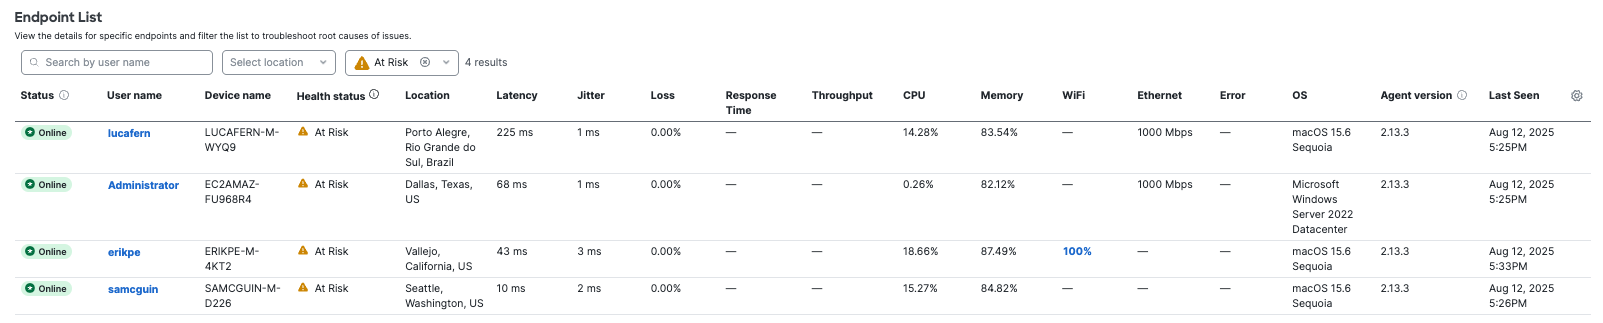
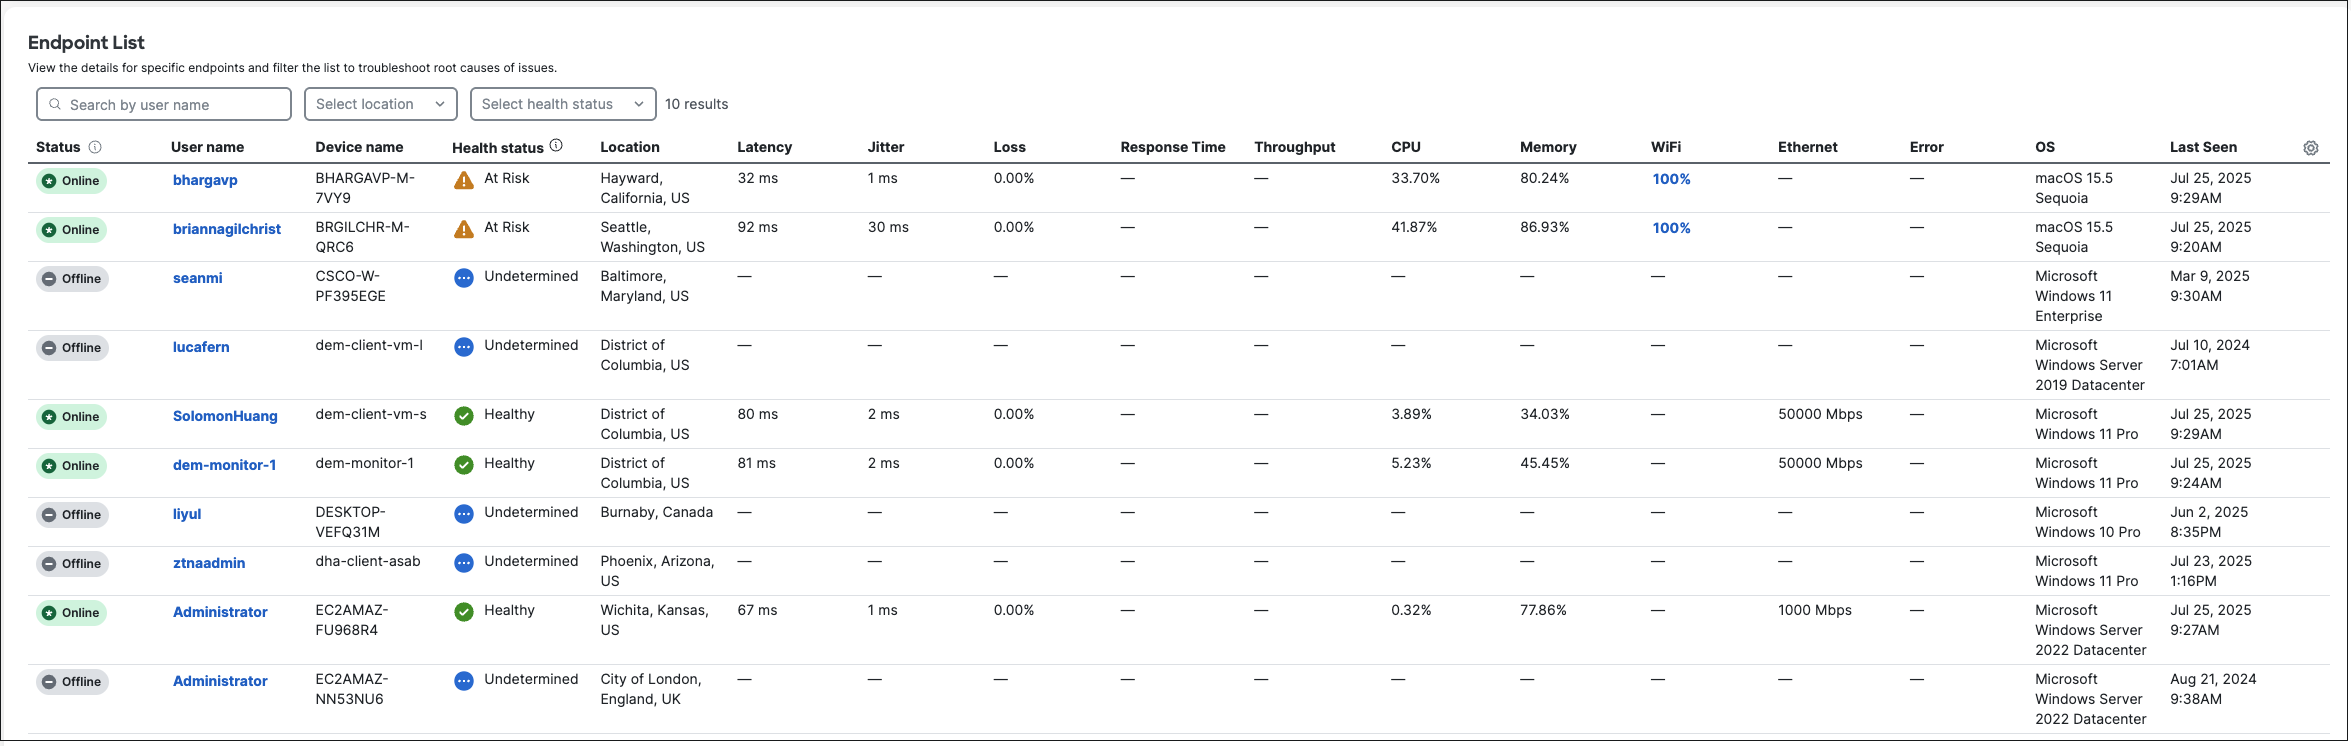
- Navigate to Experience Insights > Overview then scroll to Endpoint List.
- Use search and filter options to review endpoint table results by user name, location, or health status. Search using multiple criteria is not supported (for example, you cannot search by location AND health status).
Experience Insights defines metrics as follows. For more information, see ThousandEyes Metrics: What Do Your Results Mean?
- Latency: The average of the round-trip packet time. Round-trip packet time is the time from which a packet is sent by the agent to the time the agent receives a reply.
- Jitter: The mean deviation of latency. The mean deviation represents how far, on average, all measurements are from the mean of the data.
- Loss: End-to-end packet loss. The percentage of packets lost is calculated by subtracting the number of reply packets the agent receives from the target (responses) from the number of packets sent by the agent, then dividing by the number of packets sent, then multiplying by 100.
- Throughput: Throughput (MB/s): The throughput, measured in megabytes per second. This is the Wire Size divided by the Receive Time.
- Wire Size: The size of the object while in transmission. Often, HTTP responses are compressed prior to transmission, so wire size may be less than actual size if the object is compressed by the server. Note: Wire size is not displayed in Experience Insights.
- Receive Time: The time elapsed receiving the response from the server (time from first byte to last byte of payload). Note: Receive time is not displayed in Experience Insights.
- Response time: The time elapsed from the beginning of the request (before the DNS request) until the client receives the first byte of the response from the server. Also known as time-to-first-byte.
- An endpoint with a Health status of Undetermined indicates one of the following scenarios in which Experience Insights has not received test data from the endpoint agent.
- The endpoint is offline.
- The endpoint agent is disabled.
- The endpoint agent is online but the test was interrupted by an error reported in the Error column.
- Use the endpoint table to monitor endpoints that have not updated to the latest ThousandEyes agent version. For more information about features and fixes delivered by each agent version, see the ThousandEyes Changelog for Endpoint Agent Client release notes.
- Endpoint health metrics reported by an out-of-date agent may not match metrics reported by up-to-date agents.
- The ThousandEyes endpoint agent checks for updates every four hours. If an update is available, it will download in the background and attempt installation later. Updates occur only if a new version is available, typically once a month, but can be more frequent if patches are needed. If an update fails, the ThousandEyes agent version field in the Experience Insights endpoint table shows a warning icon with a tooltip.
- There is no method for retrying a failed update. However, you can download and reinstall Cisco Secure Client with the ThousandEyes Endpoint Agent Module to trigger an update to the endpoint agent. For detailed instructions, see Download Cisco Secure Client. It is not necessary to uninstall Secure Client before running the Secure Client
Setup.exewizard. Reinstalling without uninstalling means that you do not need to run the registration script to associate the endpoint with your ThousandEyes account.- For more information, see Endpoint Agent FAQ.
- The ThousandEyes endpoint agent leverages the Npcap driver library to collect metrics on Windows devices. A warning icon in the endpoint table Device name field indicates a Windows device with an Npcap version that is unsupported by ThousandEyes. ThousandEyes will not collect metrics from Windows devices with unsupported versions.
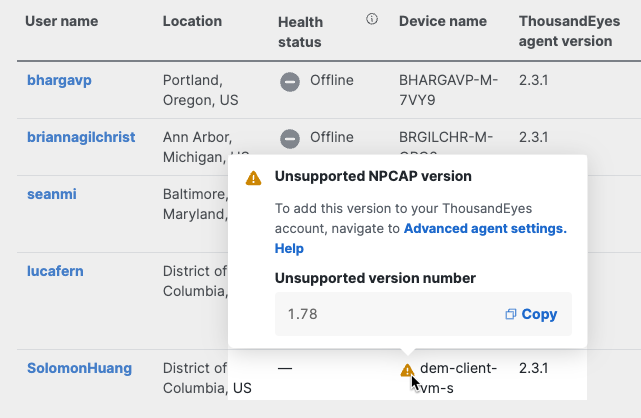
To enable unsupported versions of Npcap, navigate to Advanced agent settings in ThousandEyes. For more information, see Npcap Driver Upgrade Management in ThousandEyes documentation.
Endpoint Health Status
Experience Insights assigns a summary Health Status to each endpoint in the table and on the endpoint performance map. For more information, see View Endpoint Performance Map.
Health Status of an endpoint three endpoint metrics and three network metrics. These thresholds determine the health status of each metric:
Endpoint thresholds
| Metric | |||
|---|---|---|---|
| CPU | <80 | 80 < value < 95 | >95 |
| Memory | <80 | 80 < value < 95 | >95 |
| Wi-Fi signal | >40 | 40 > value > 20 | <20 |
Network thresholds
| Metric | |||
|---|---|---|---|
| Jitter | <30 | 30 < value < 40 | >40 |
| Packet loss | <10 | 10 < value < 20 | >20 |
| Average latency | <100 | 100 < value < 150 | >150 |
Experience Insights calculates endpoint health status as follows:
 Healthy when all six metrics are in the healthy threshold.
 At Risk when at least one of the six metrics is at risk.
  Unhealthy:
- When Wi-Fi signal is in the unhealthy threshold.
- Or, when all three network metrics are in the unhealthy threshold: Jitter, Packet loss, Average latency.
Note: If an endpoint's CPU or Memory metric is in the unhealthy threshold when others are not, summary Health Status will be at risk, not unhealthy.
View Endpoint Performance Map < View Summary of Endpoints > Wi-Fi Descriptions
Updated about 2 hours ago