Activity Volume Report
The Activity Volume Report provides an overall summary of traffic by security categories and policies affected by content categories and Destination Lists. You can view traffic allowed and blocked across these fields as well as the percentage of this traffic for each field and determine which activities may be a potential risk in the organization.
Prerequisites
- A minimum user role of Read-only. For more information, see Manage Accounts.
View Requests by Volume of Activity
- Navigate to Monitor > Reports > Activity Volume.
You are presented with a chart that depicts categorized requests over time.
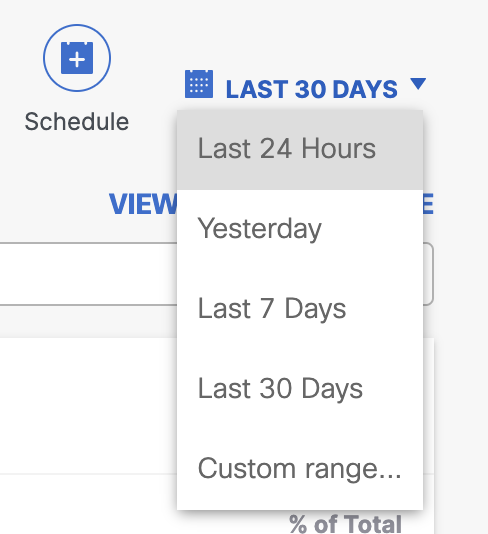
- Choose a time frame to view the activity volume.
The Activity Volume Report can be filtered by the Last 24 hours, Yesterday, Last 7 Days, Last 30 Days, or a custom range within the last 30 days.
- If necessary, filter by a specific identity using the search tool.
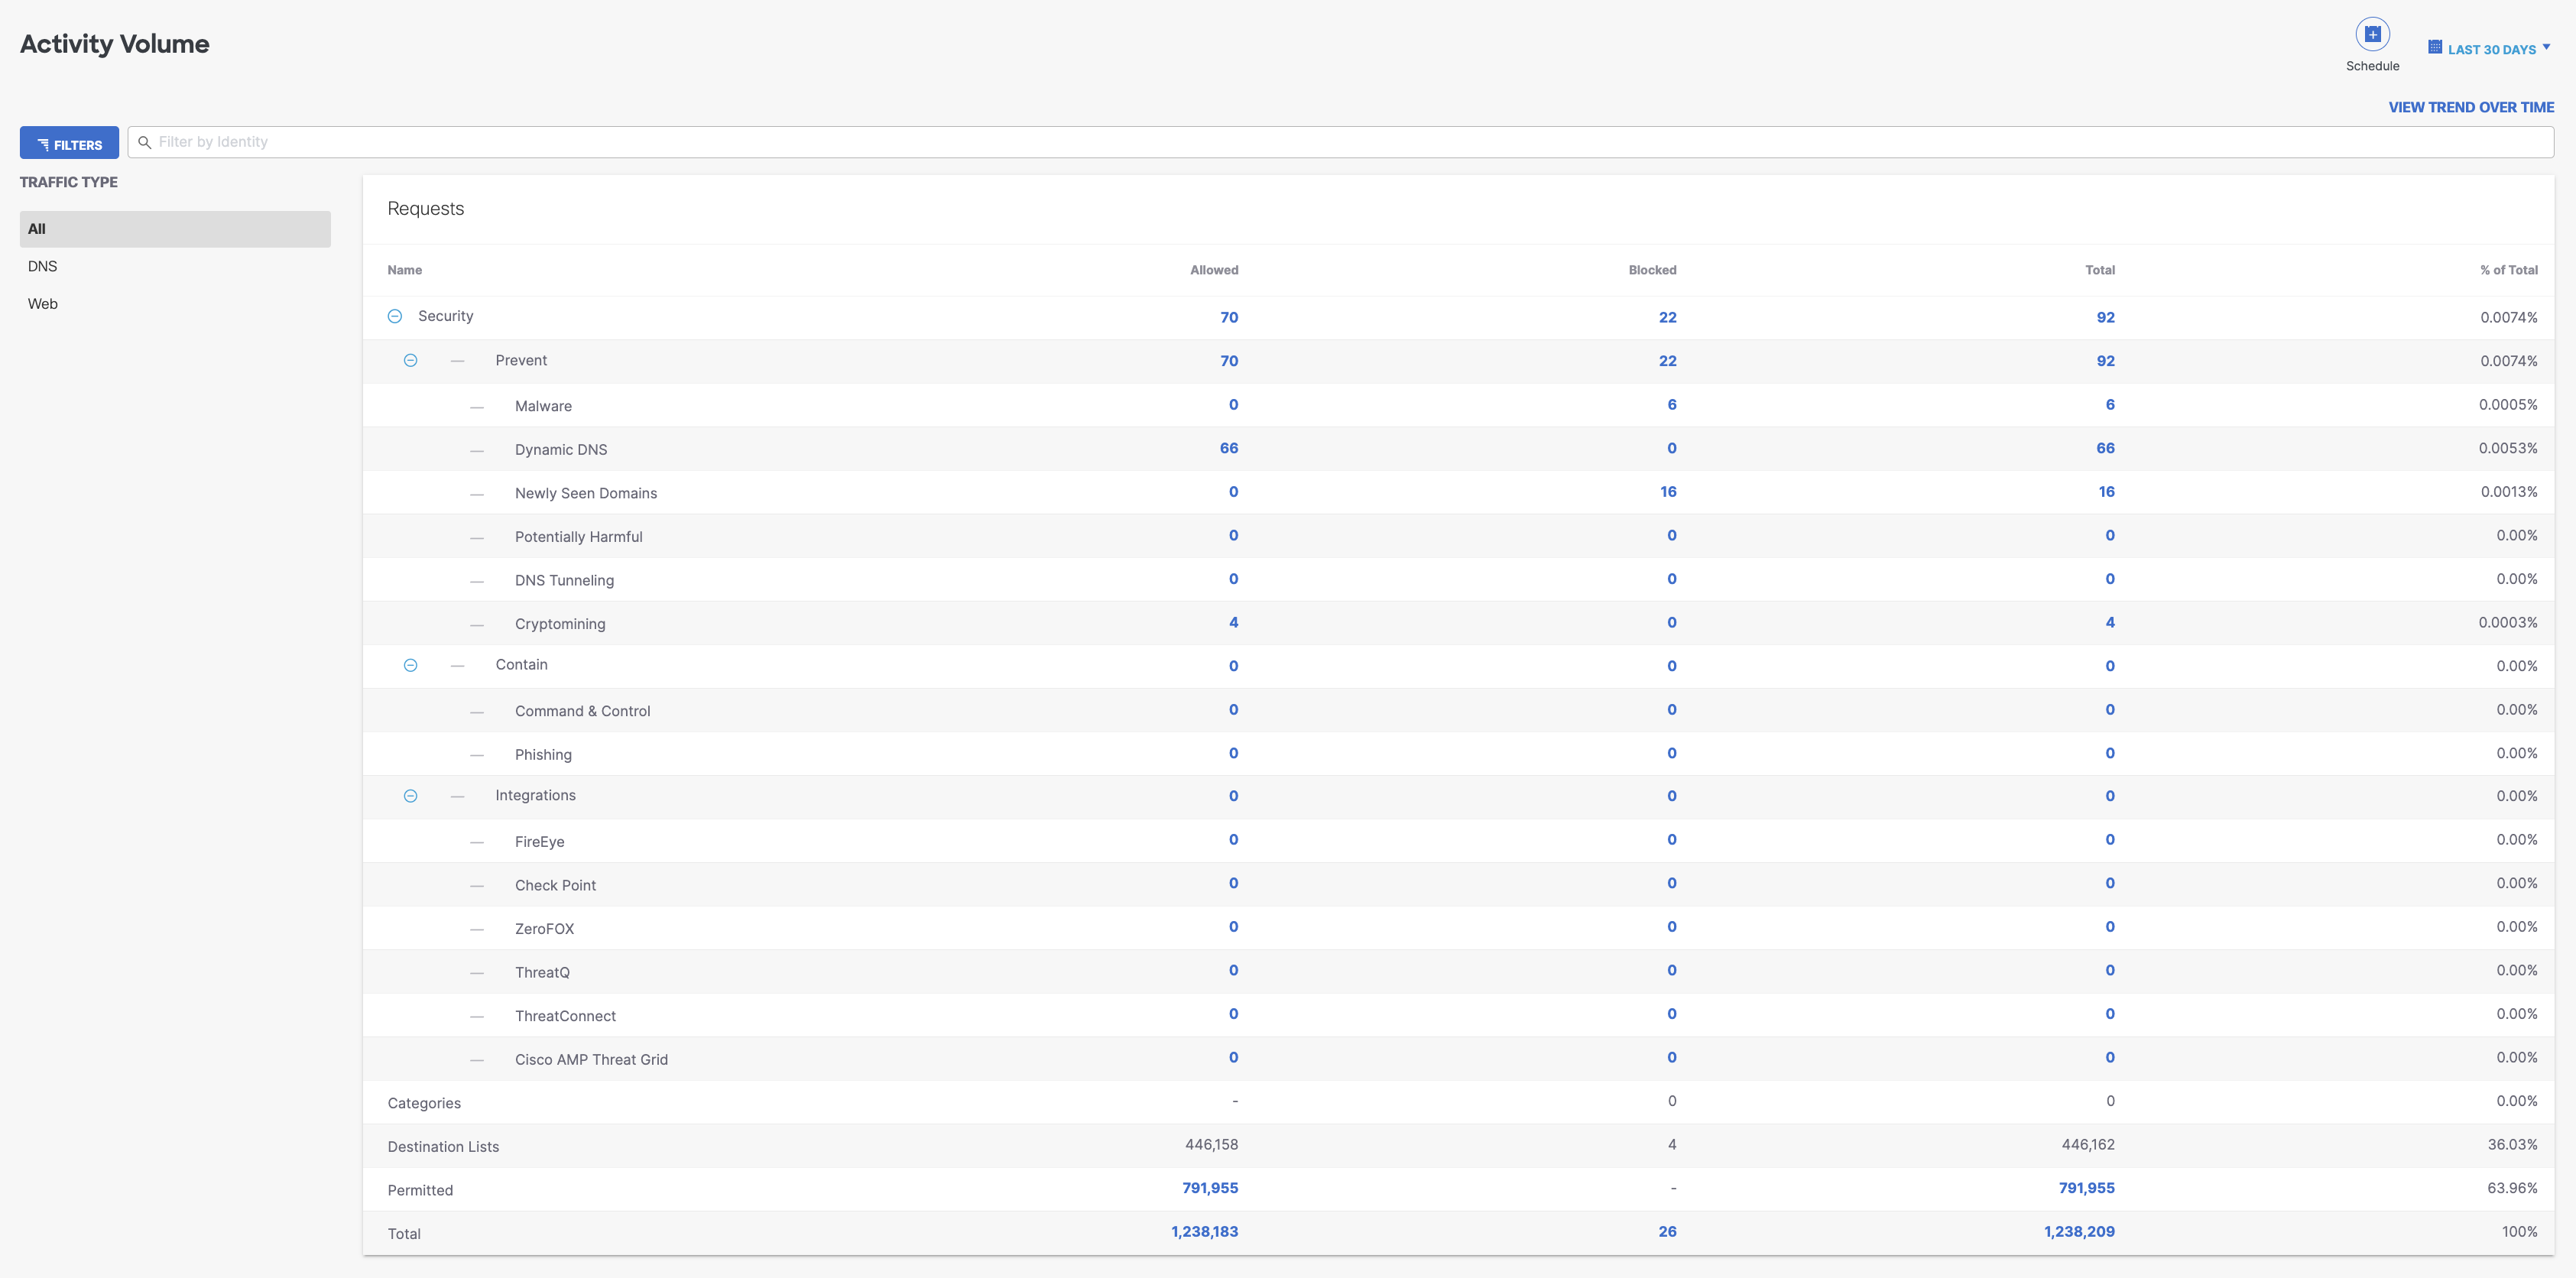
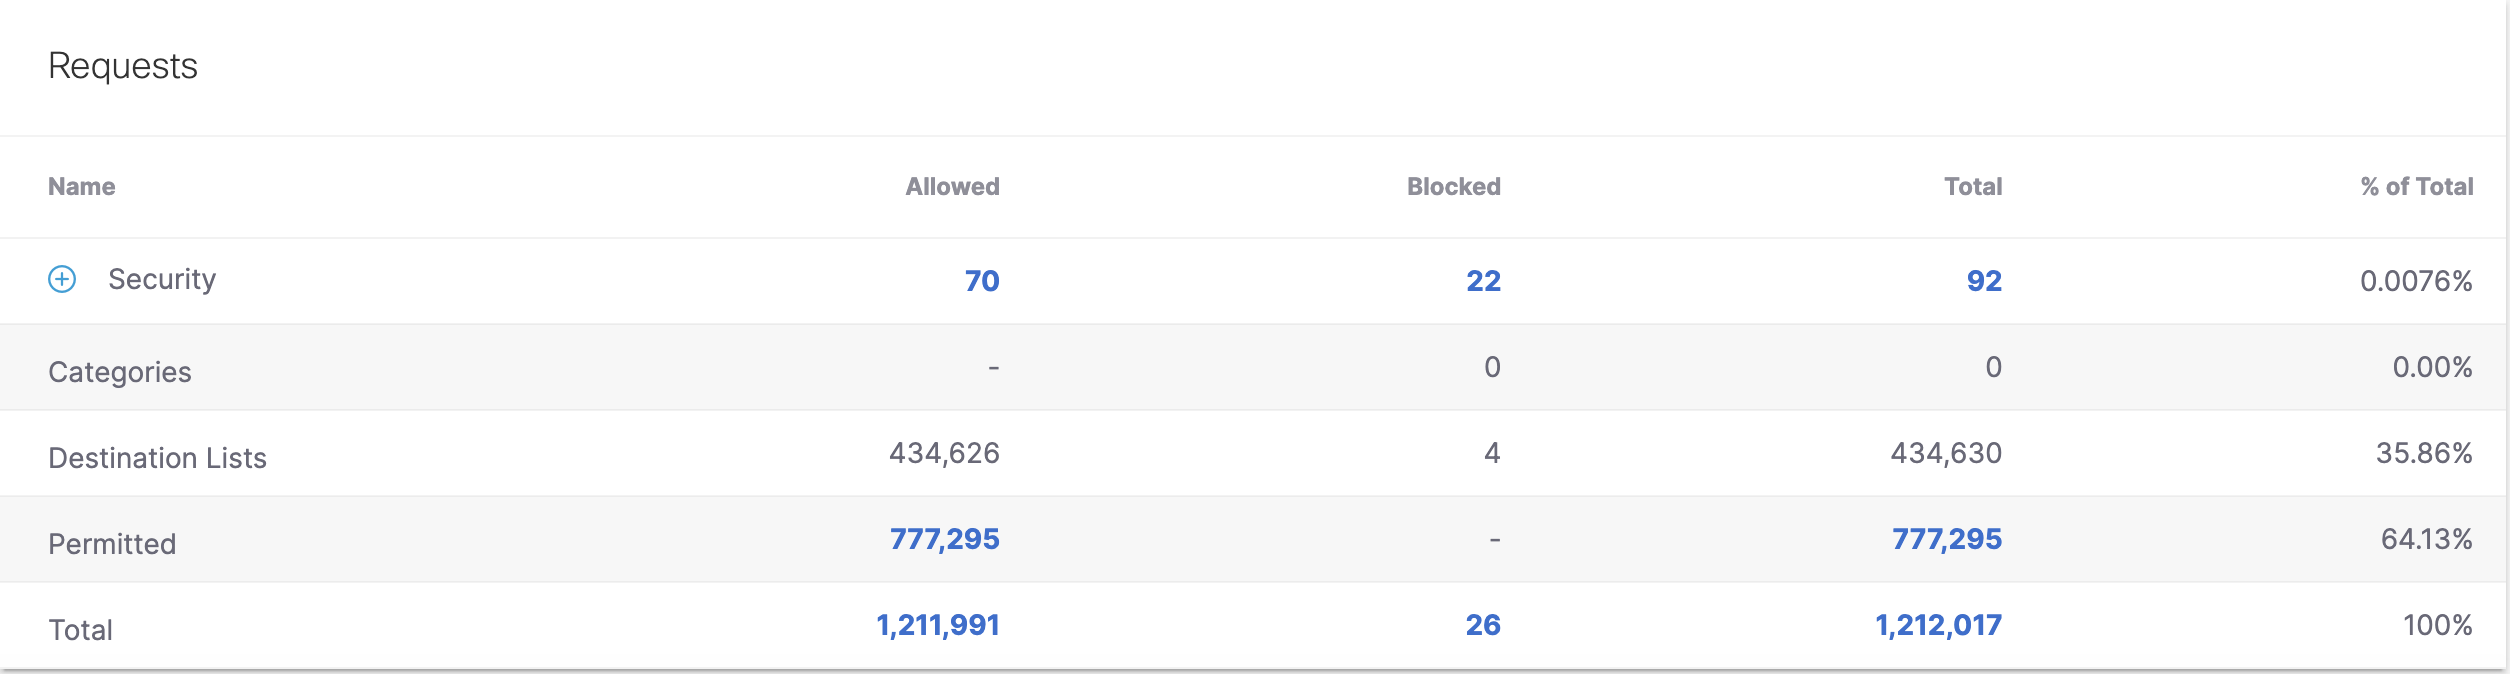
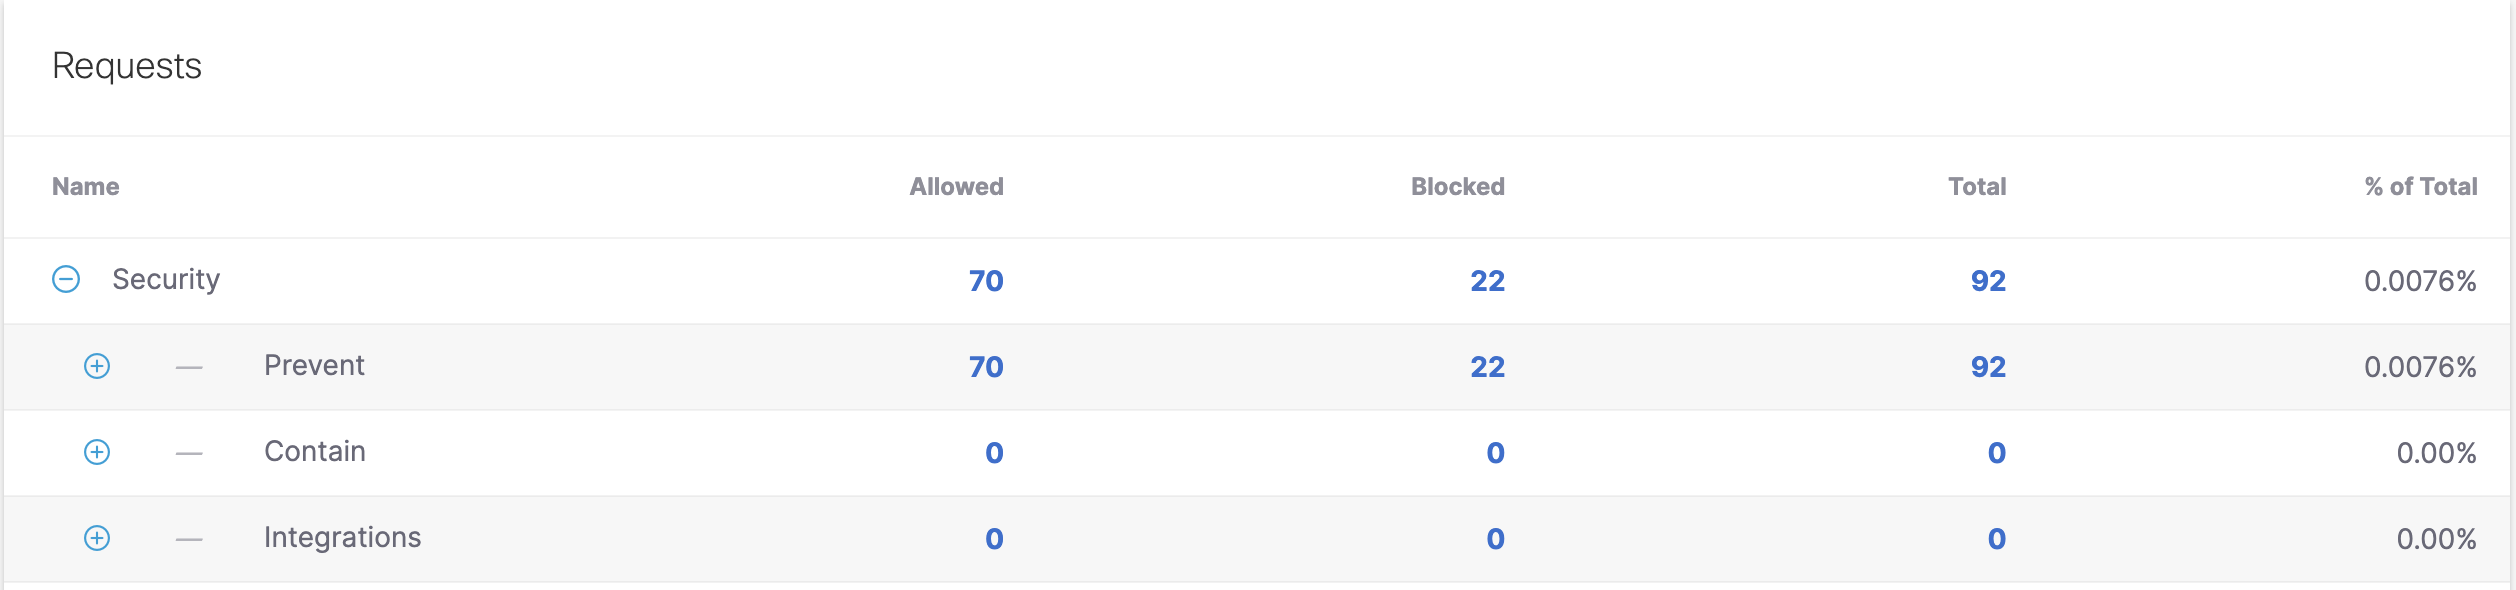
The Activity Volume Report consists of three main fields of activity (Security, Categories, and Destination Lists), the total Permitted requests, and the Total requests of all traffic. Each field displays the number of requests Allowed, Blocked, the Total number of requests, and the Percentage of all requests that that field represents.
Note: Allowed Categories do not display any results.
View Activity Volume by Threat Categories
The Security field contains two sub-fields of traffic data relating to potential security risks: Prevent and Contain. For more information about threat categories, see Threat Category Descriptions. Integrations are not applicable to Secure Access.
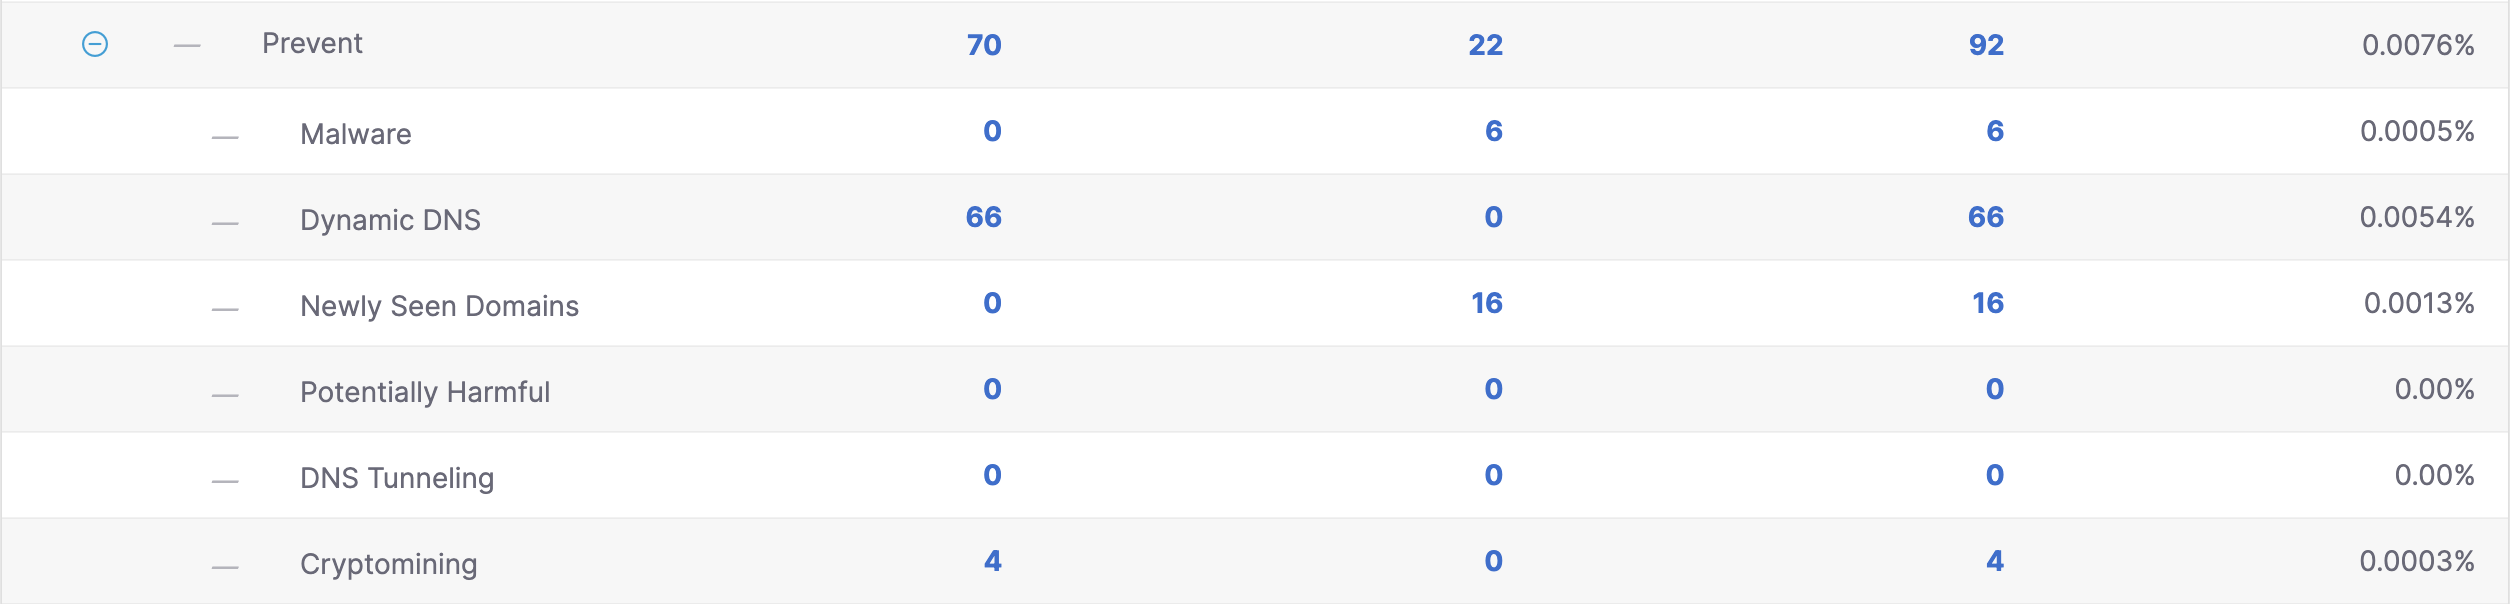
Prevent
The Prevent security section lists the threat categories utilized to prevent threats and risks in your environment. The chart provides the number of Allowed, Blocked, Total Requests, and the percentage of Total Requests for each category. The data here provides an insight as to which categories receive the most requests which can determine if policies need to be updated or configured differently.
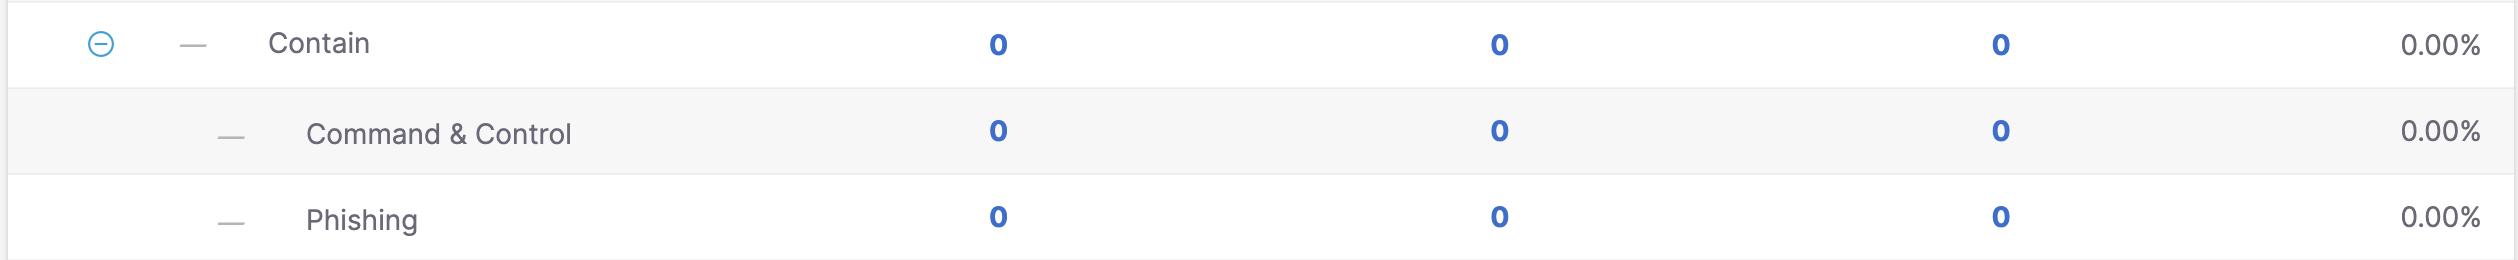
Contain
The Contain section lists two threat categories in which threats are contained and prevented from spreading in your environment. The chart provides the number of Allowed, Blocked, Total Requests, and the percentage of Total Requests for each category.
View Activity Volume by Policy Traffic
The Categories and Destination Lists fields provide an insight into traffic where requests were allowed or blocked due to policies configured with content categories and destination lists. The chart provides the number of Allowed, Blocked, Total Requests, and the percentage of Total Requests for each field. This information shows what types of policies are receiving the most traffic and may need more efficient management.

View Trends
Click the View Trend Over Time button to be redirected to the Total Requests Report for an enhanced visualization of traffic trends over a given period of time.
Total Requests Report < Activity Volume Report > App Discovery Report
Updated about 1 year ago