View Activity and Details by Filters
The Security Activity report gives you the ability to monitor and discover threats to your organization by displaying traffic patterns. You can filter these results by event type, category, time period, and type of request.
Note: Secure Access reports are time-dependent. Secure Access time is UTC by default but can be changed to a different timezone on a per-user basis. Navigate to Admin > Accounts and update your account's time setting.
Prerequisites
- A minimum user role of Read-only. For more information, see Manage Accounts.
Procedure
- Navigate to Monitor > Reports > Security Activity.
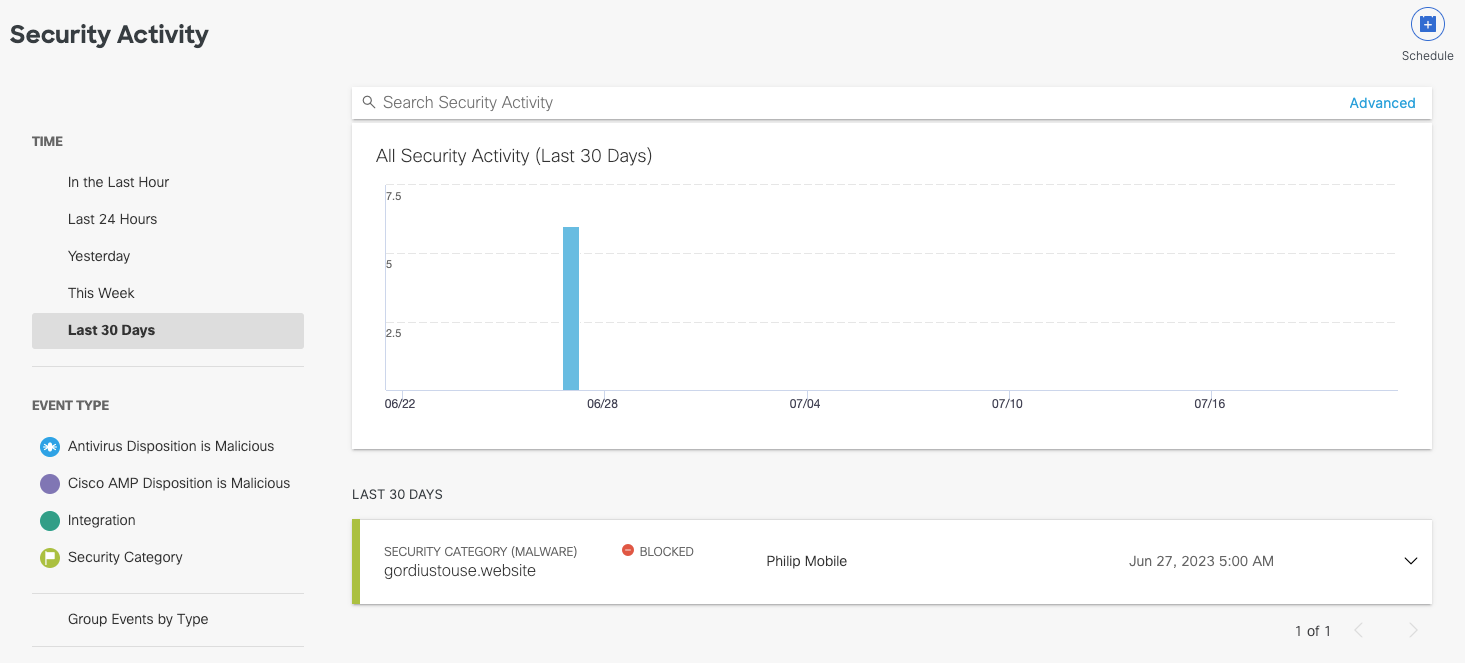
- Choose a time period of events to view. You can generate a report to document activities for the last hour, the last 24 hours, the previous calendar day (yesterday), the last seven days, and the last month.

- Choose which security event types or categories you want to view in the report. By default, all events and categories are selected to display activity for all event types.
- Antivirus Disposition is Malicious—Lists events that have been filtered through a virus scan.
- Cisco AMP Disposition is Malicious—Lists events that have been filtered through Cisco Advanced Malware Protection (AMP).
- Security Category—Lists events allowed or blocked against selected security categories: Command and Control, Cryptomining, Malware, Phishing, and Other Categories (Contains Dynamic DNS, Newly Seen Domains, and Potentially Harmful).

- For Response, select Allowed, Blocked, or both.
Note: If you select Antivirus Disposition is Malicious or Cisco AMP Disposition is Malicious as the Event Type, you cannot select Response > Allowed. Secure Access cannot allow viruses to pass through the system. These will always be blocked.

Once all filters have been selected, the activity graph and event details will reflect the chosen filters. The graph will display activities for the events selected during the configured time period. The event details cards will stack from most recent to oldest.

Hovering over a bar on the graph shows details for that time period (the hour or day). Clicking the details redirects you to the Activity Search report where you can view further details for that time period filtered by Response (if only one is selected) and the security categories selected.

Security Activity Report < View Activity and Details by Filters > View Activity and Details by Event Type or Security Category
Updated over 1 year ago