Total Requests Report
The Total Requests Report provides a visualization of traffic over a given time period. Based on selected categories, traffic type, and responses, you can see what traffic trends occur in your environment.
Prerequisites
- A minimum user role of Read-only. For more information, see Manage Accounts.
View Trends in the Total Requests Report
- Navigate to Monitor > Reports > Total Requests.
You will see filters to the left of the trend graph.
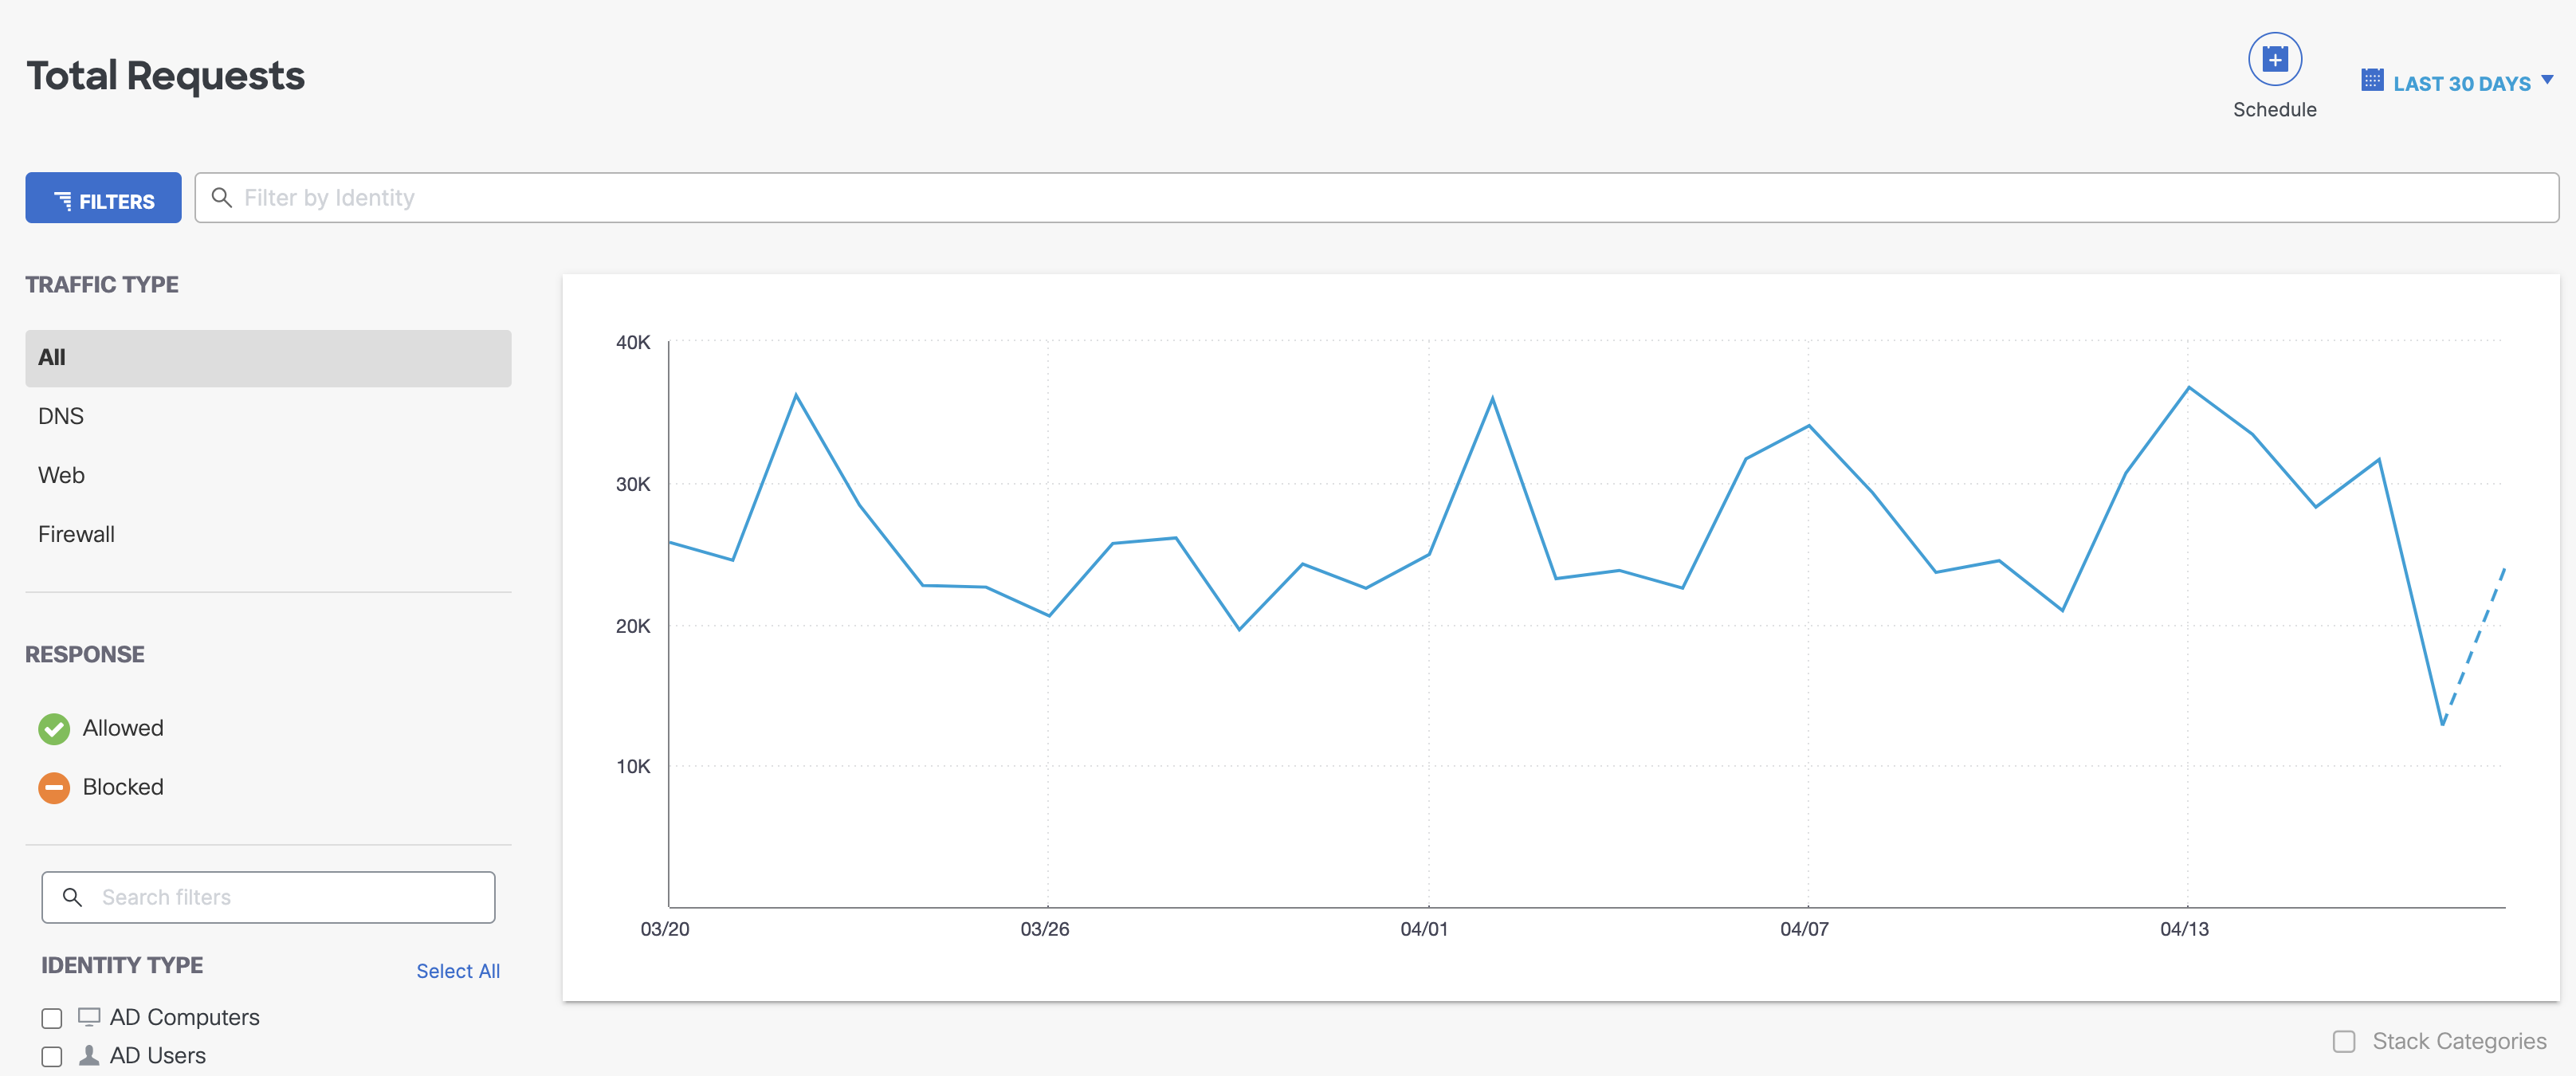
- Choose a time frame to view the report's results.
The Total Requests Report can be filtered by time: the last 24 hours, the previous calendar day (yesterday), the last seven days, and the last month.

- Filter the results by the type of response.
You can filter by Blocked requests or Allowed requests. By default, nothing is selected, so all responses are shown.

- Filter by specific identity types.
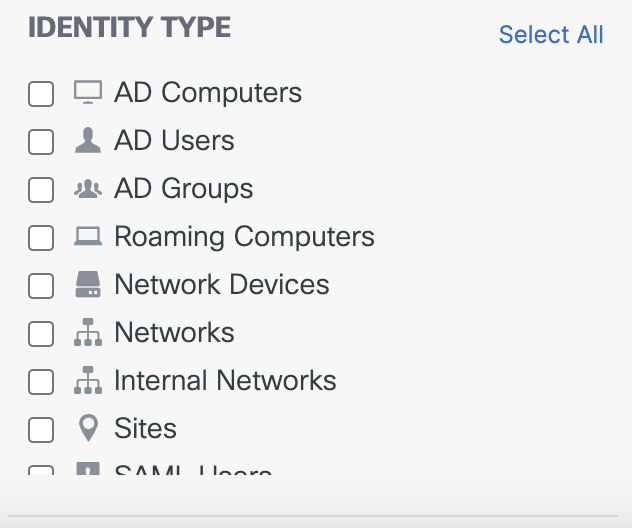
Alternatively, if you are looking for a specific identity to filter your results, enter it in the search bar.
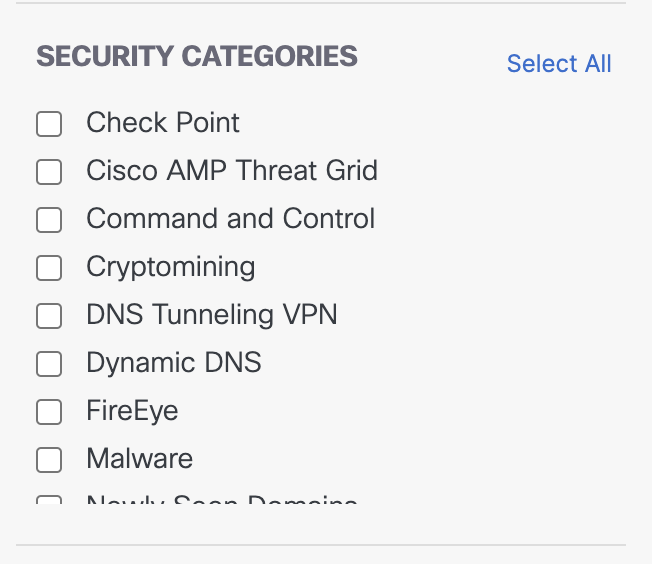
- Filter by specific security categories.
For more information about threat categories, see Manage Threat Categories and Threat Category Descriptions.
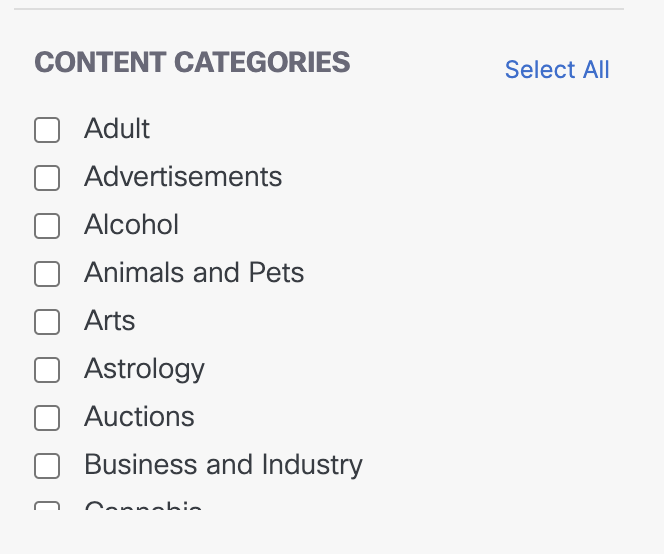
- Filter by specific content categories.
For a full list of content categories, see Available Content Categories.
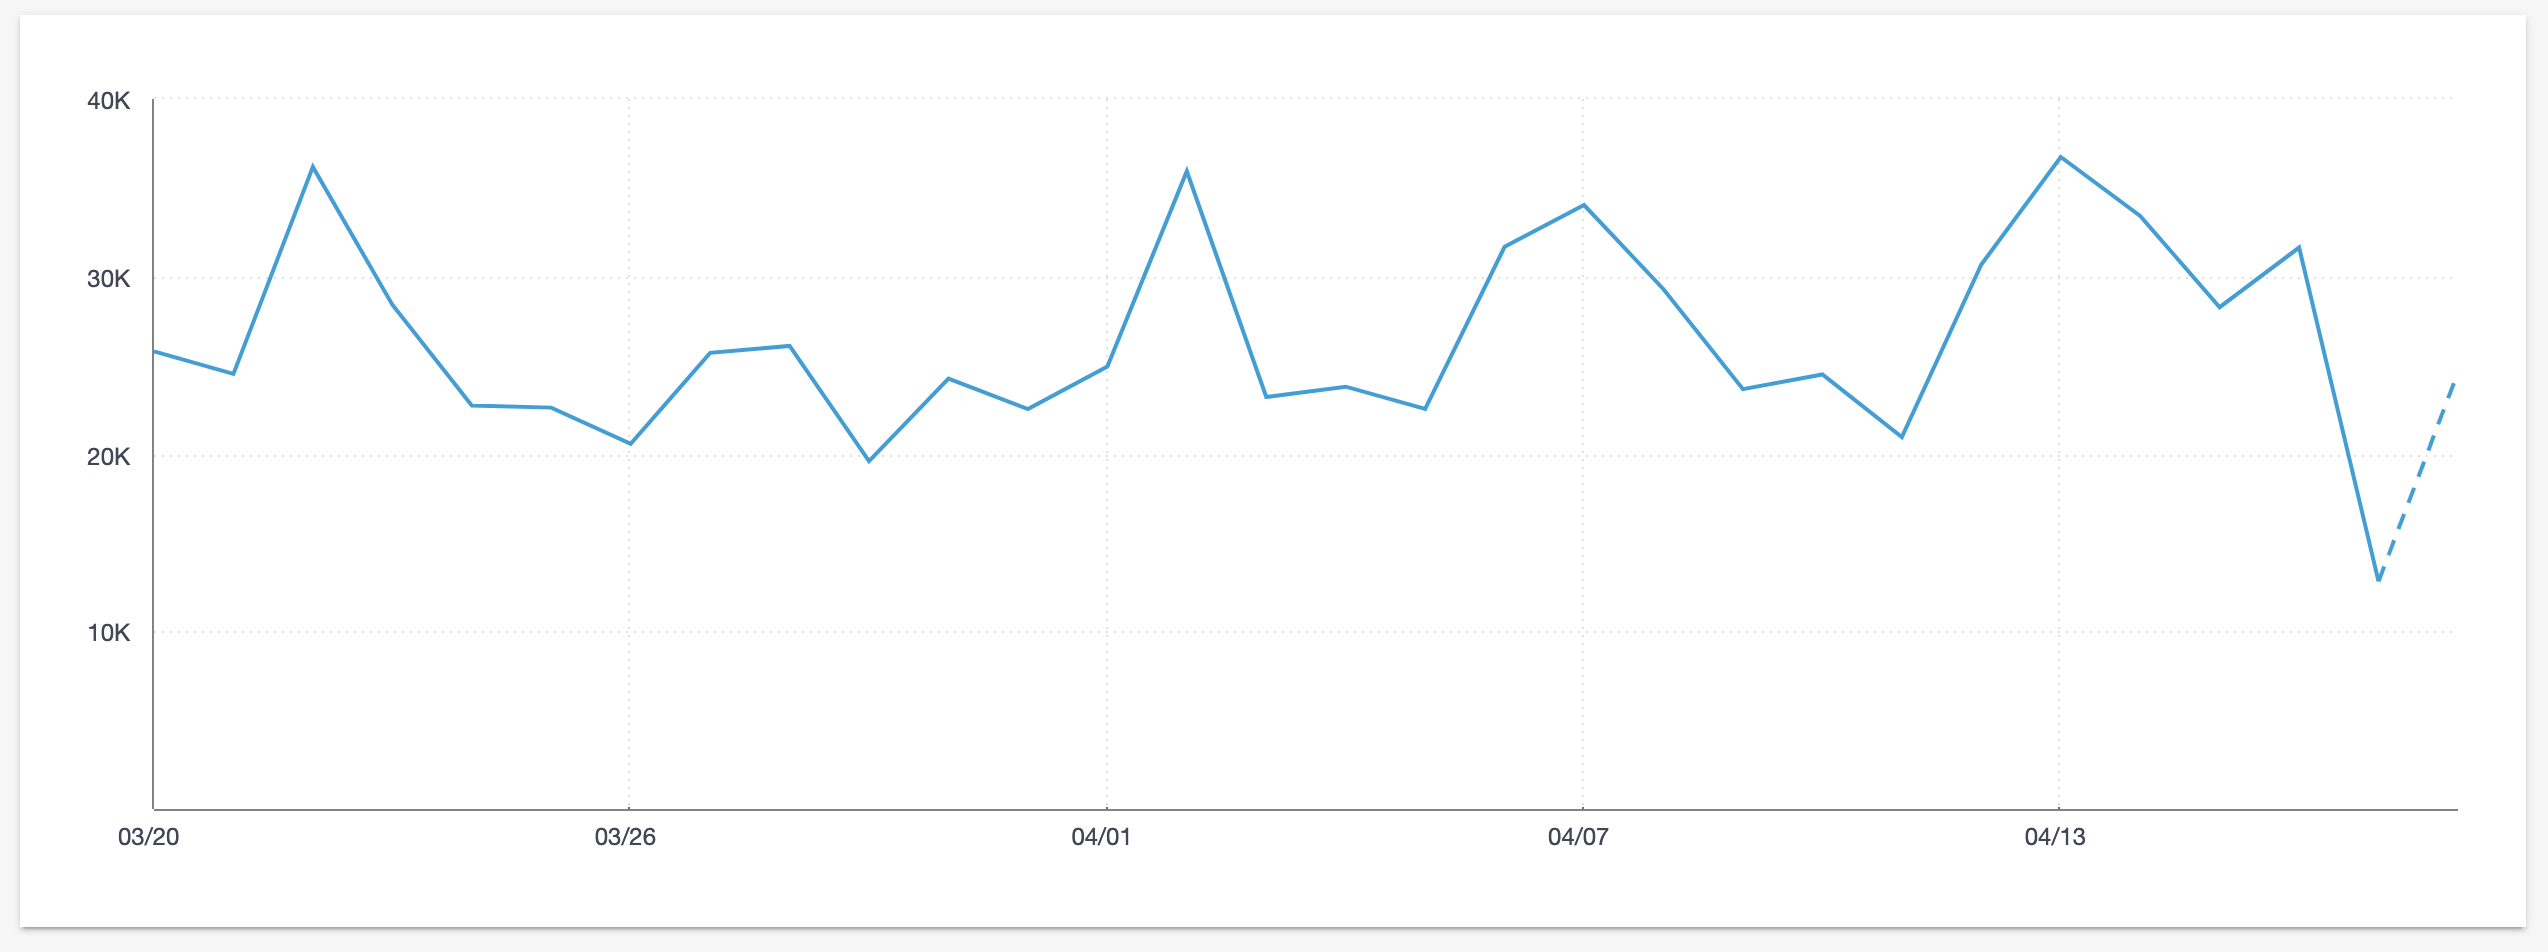
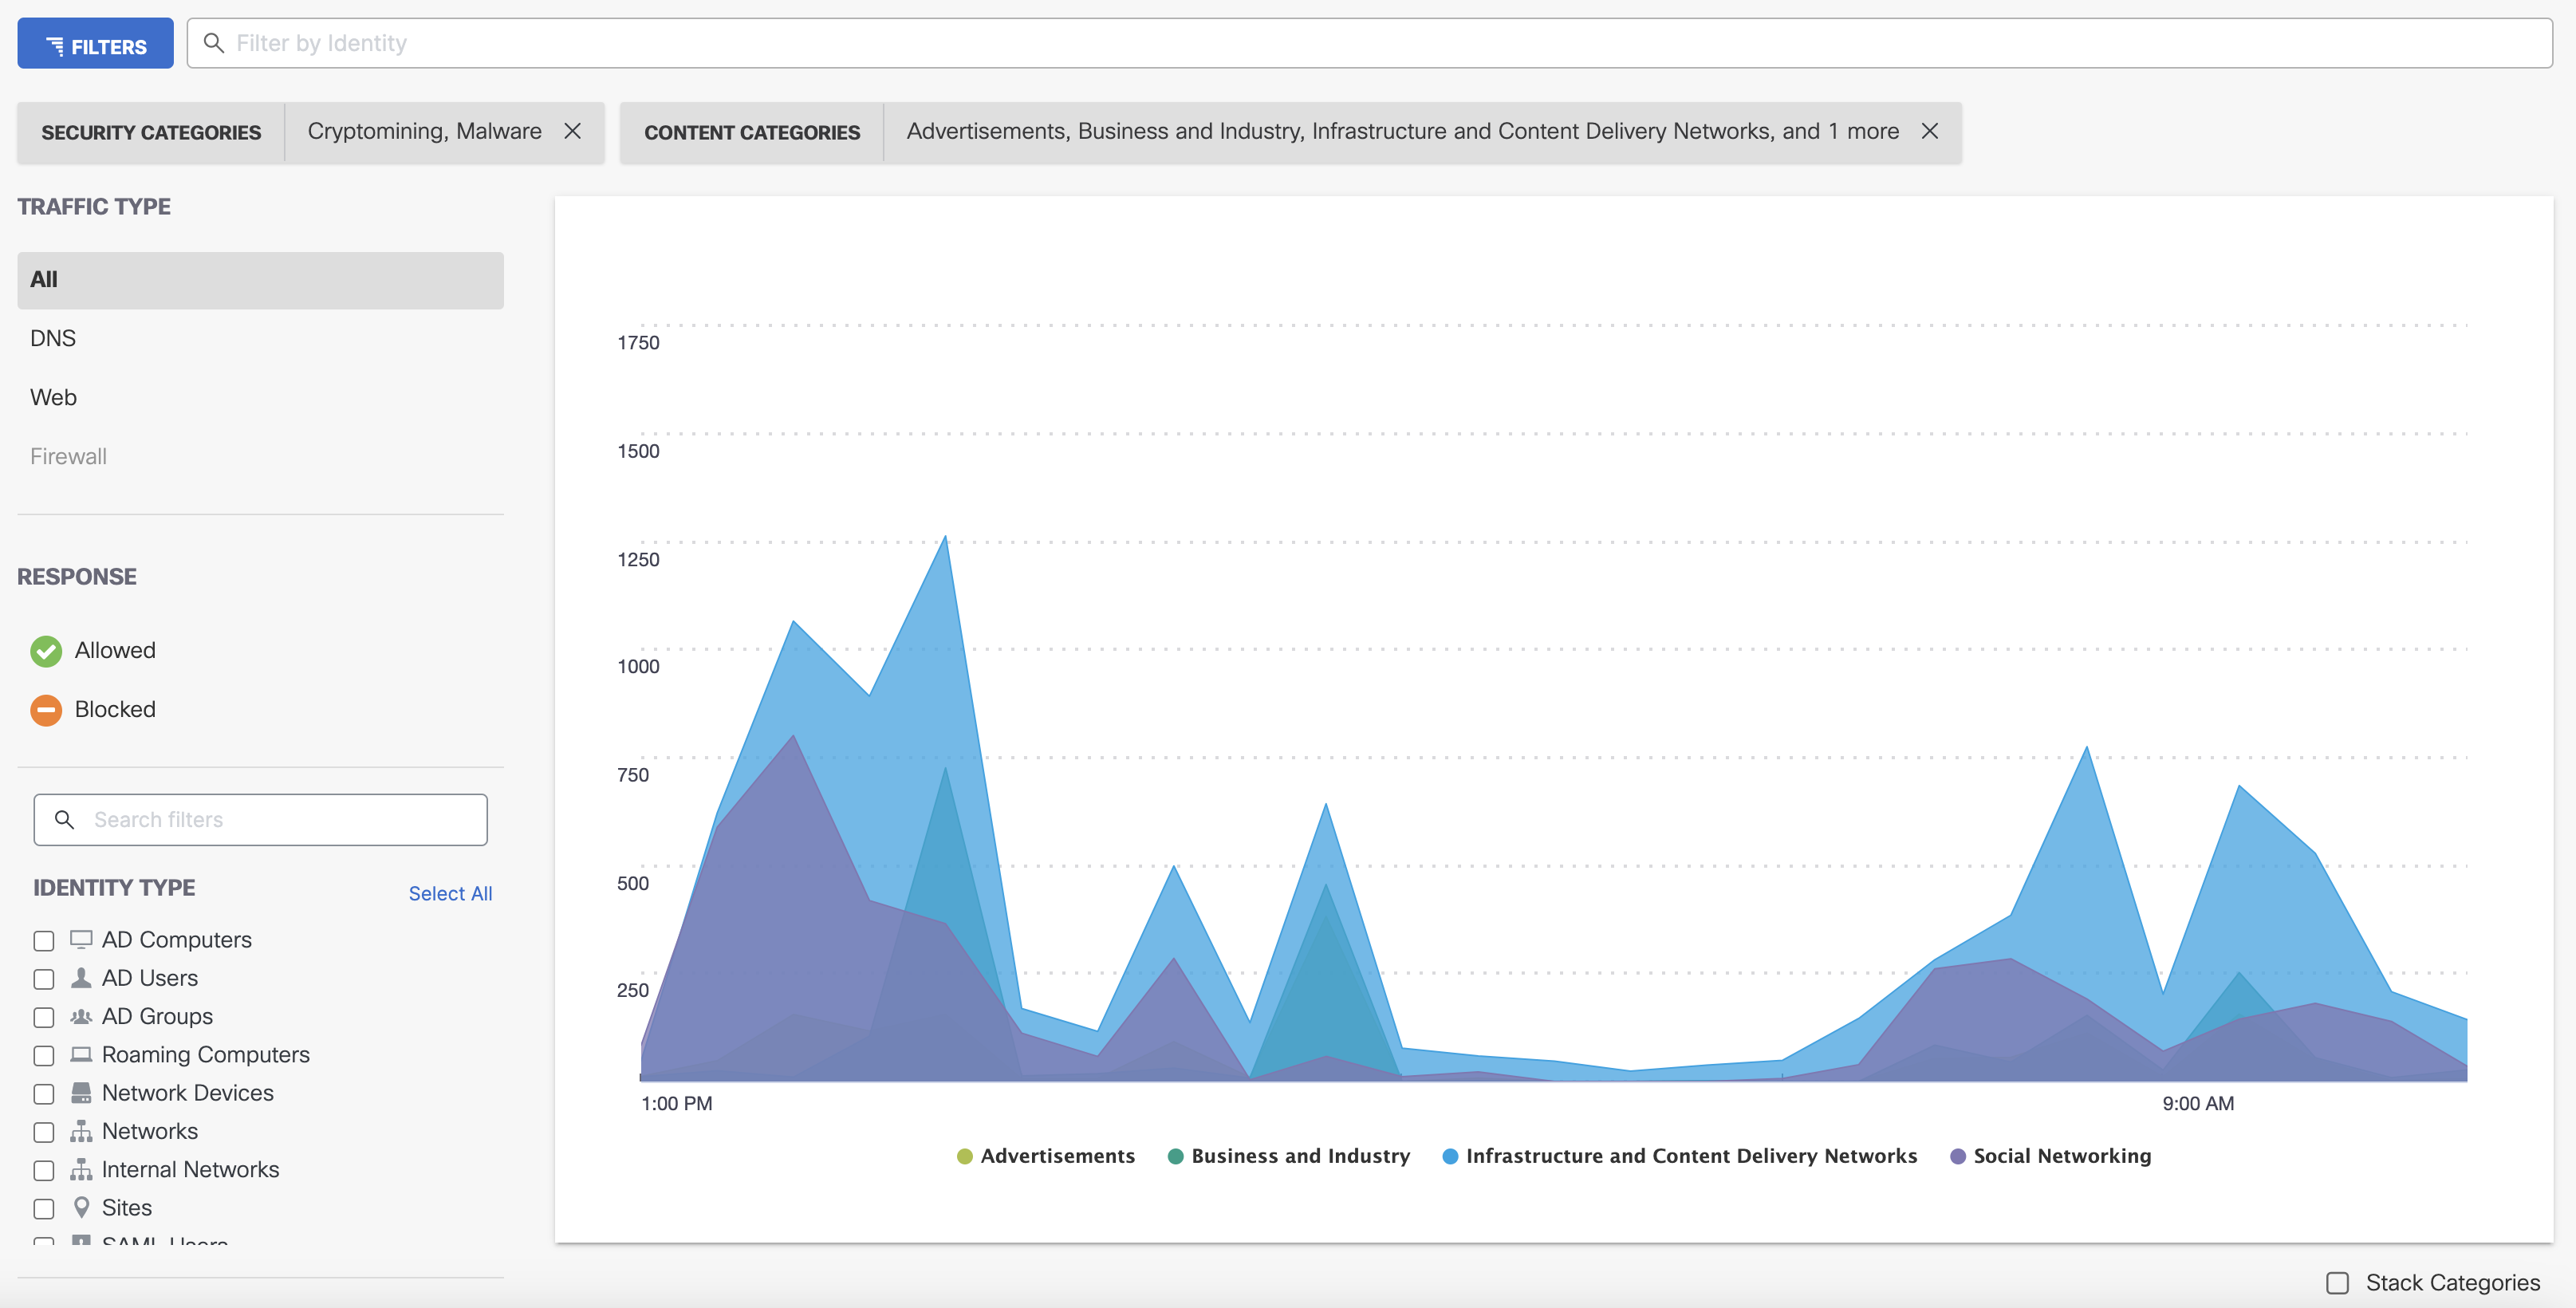
Once all filters have been selected and applied, the trend graph will update to reflect the appropriate total request data. When no security or content categories are selected, the graph remains a line that reflects the time frame, responses, and identity types selected.
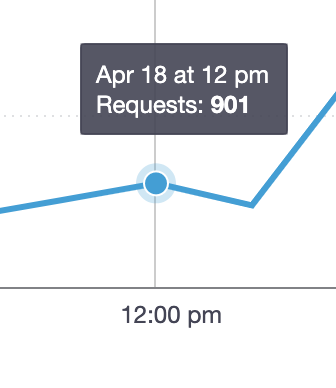
Hovering on a point on the graph will show the date, time and number of requests for that timestamp.
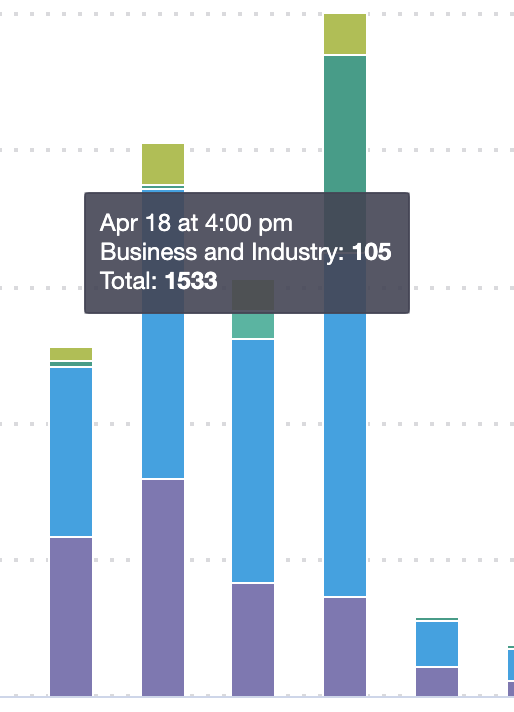
When you do filter by security or content categories, the trend graph will change to a bar graph of the requests for those categories within the selected time frame and other filters. Categories can be stacked if multiple categories showed traffic for those dates by clicking the Stack Categories checkbox.
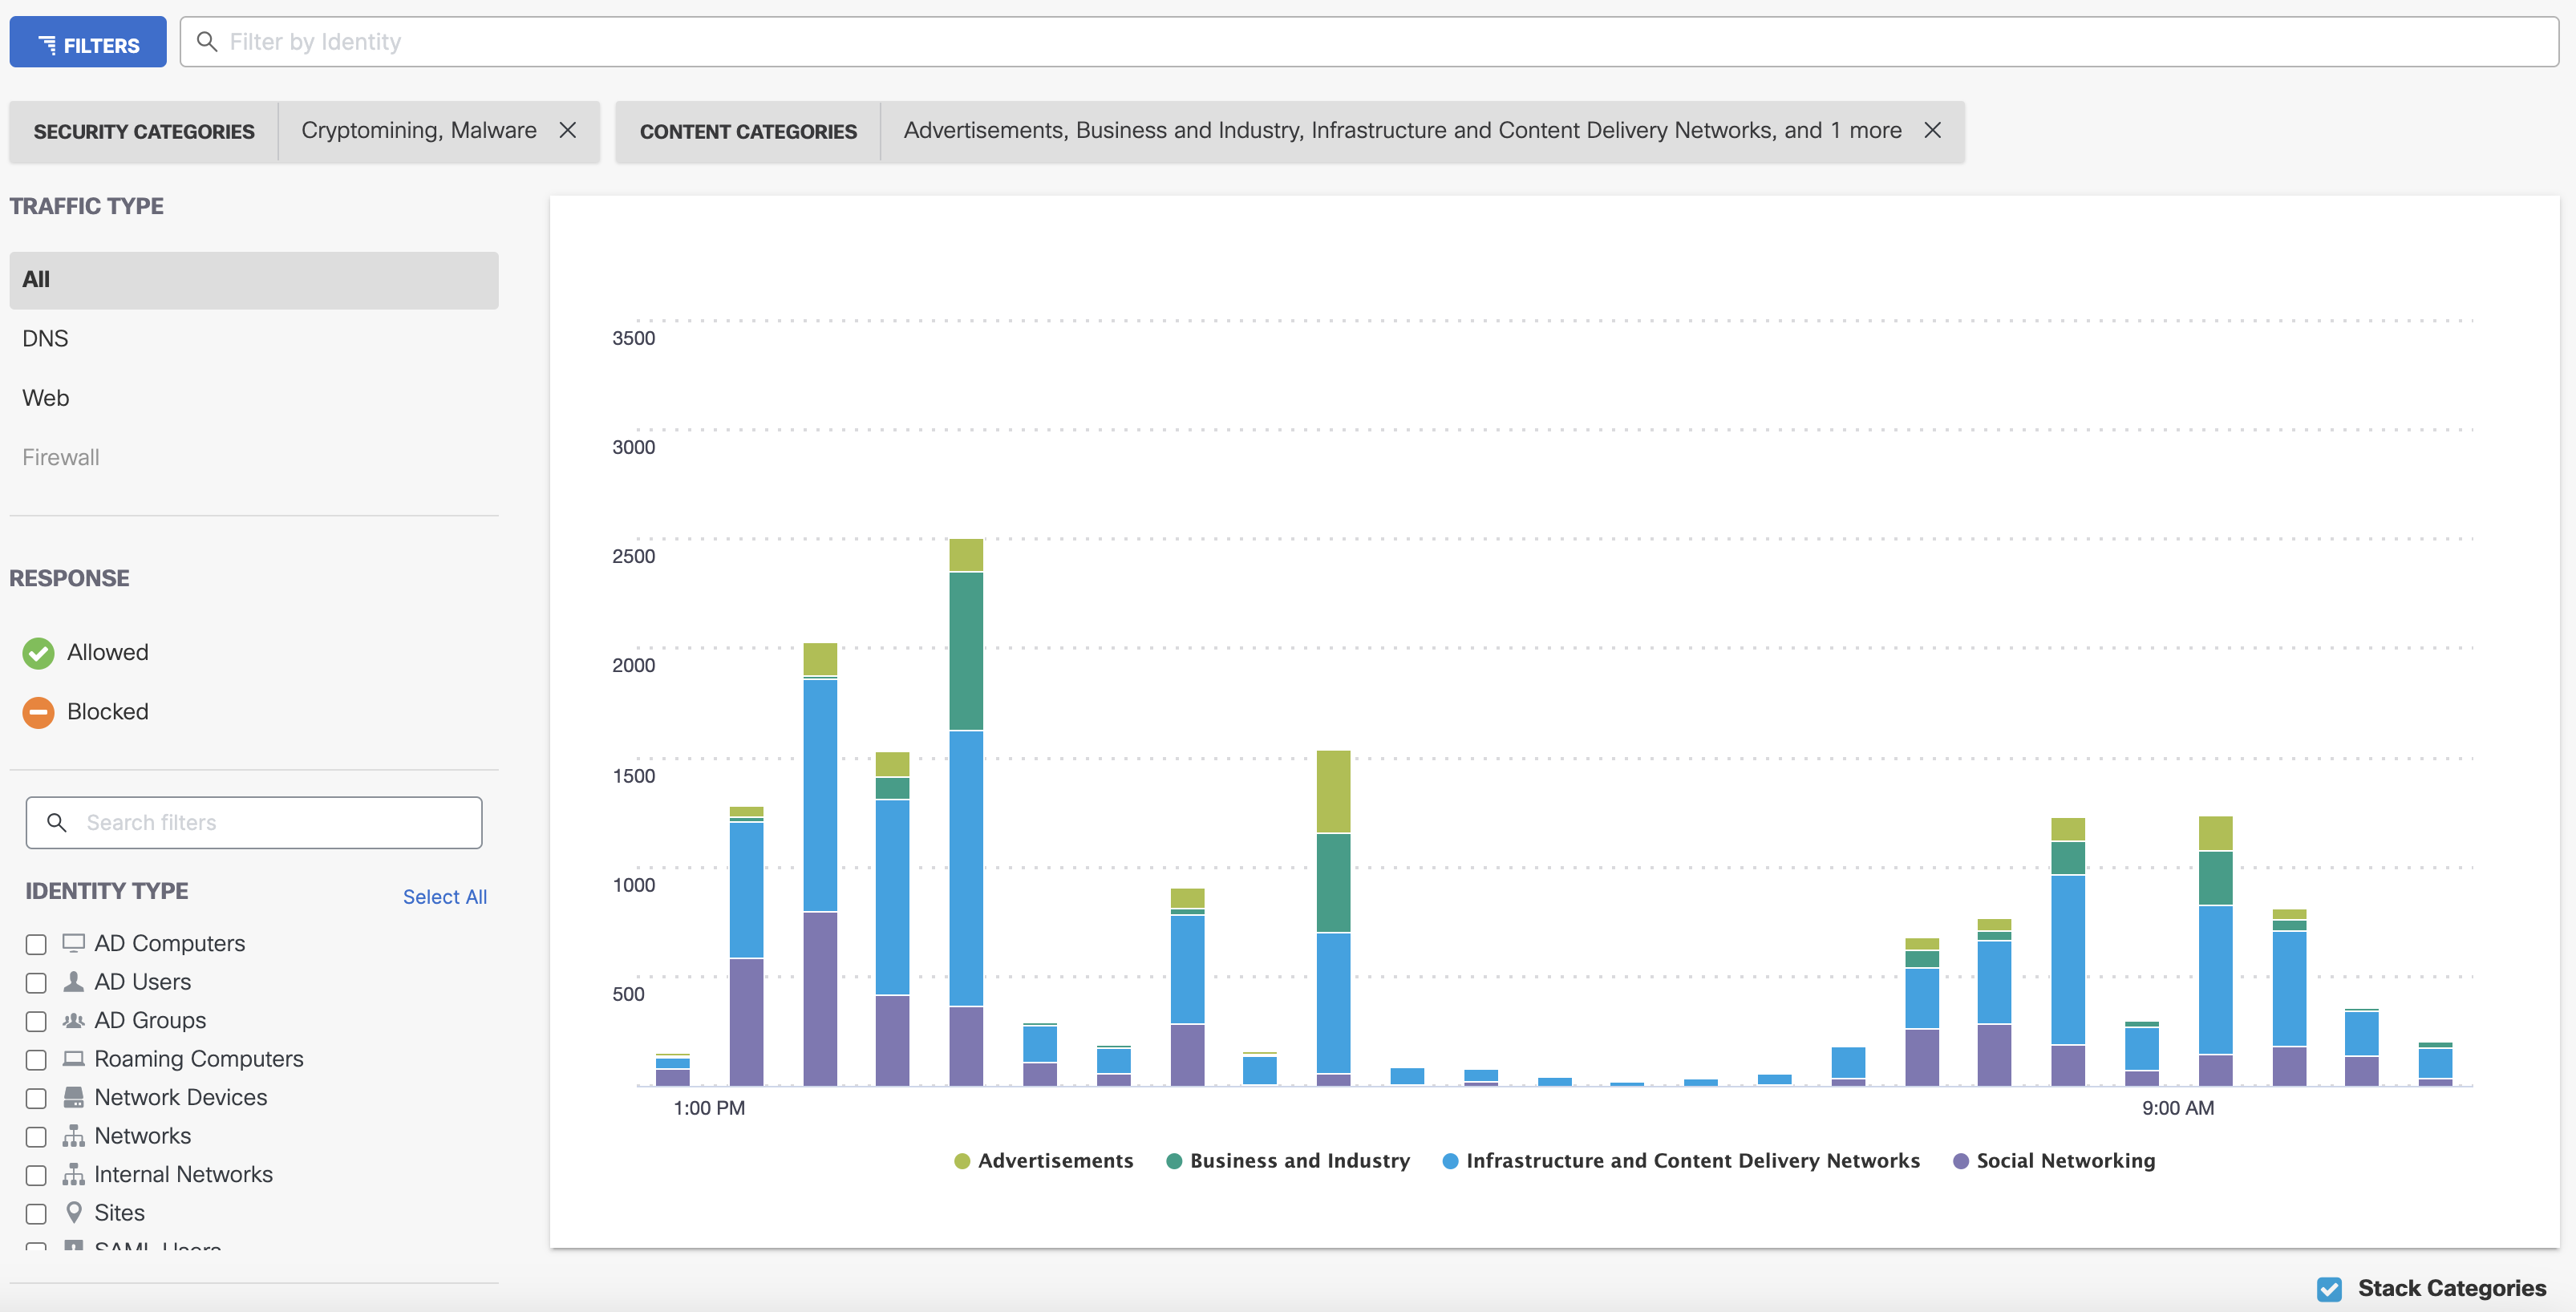
Hovering on a category for a specific date and time will show the total requests for that category as well as the overall total requests for that timestamp.
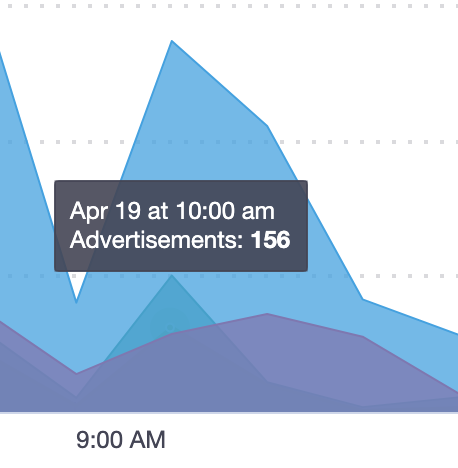
You can also choose to view the categories unstacked, by unchecking the Stack Categories checkbox.
Hovering on a point on the graph will show the total requests for that category at that time.
Clicking a category on either graph type will redirect you to the Category Details for that category.
Search for Security Activity < Total Requests Report > Activity Volume Report
Updated 3 months ago