Category Details
The Category Details for an individual category provide you with a focused view of the category's traffic and related sources and domains for a selected time period.
Table of Contents
- Prerequisites
- View a Category's Details Overview
- View a Category's Traffic
- View a Category's Identities
- View the Category's Top Domains
Prerequisites
- A minimum user role of Read-only. For more information, see Manage Accounts.
View a Category's Details Overview
-
Navigate to Monitor > Reports > Top Categories and click one of the listed categories.
-
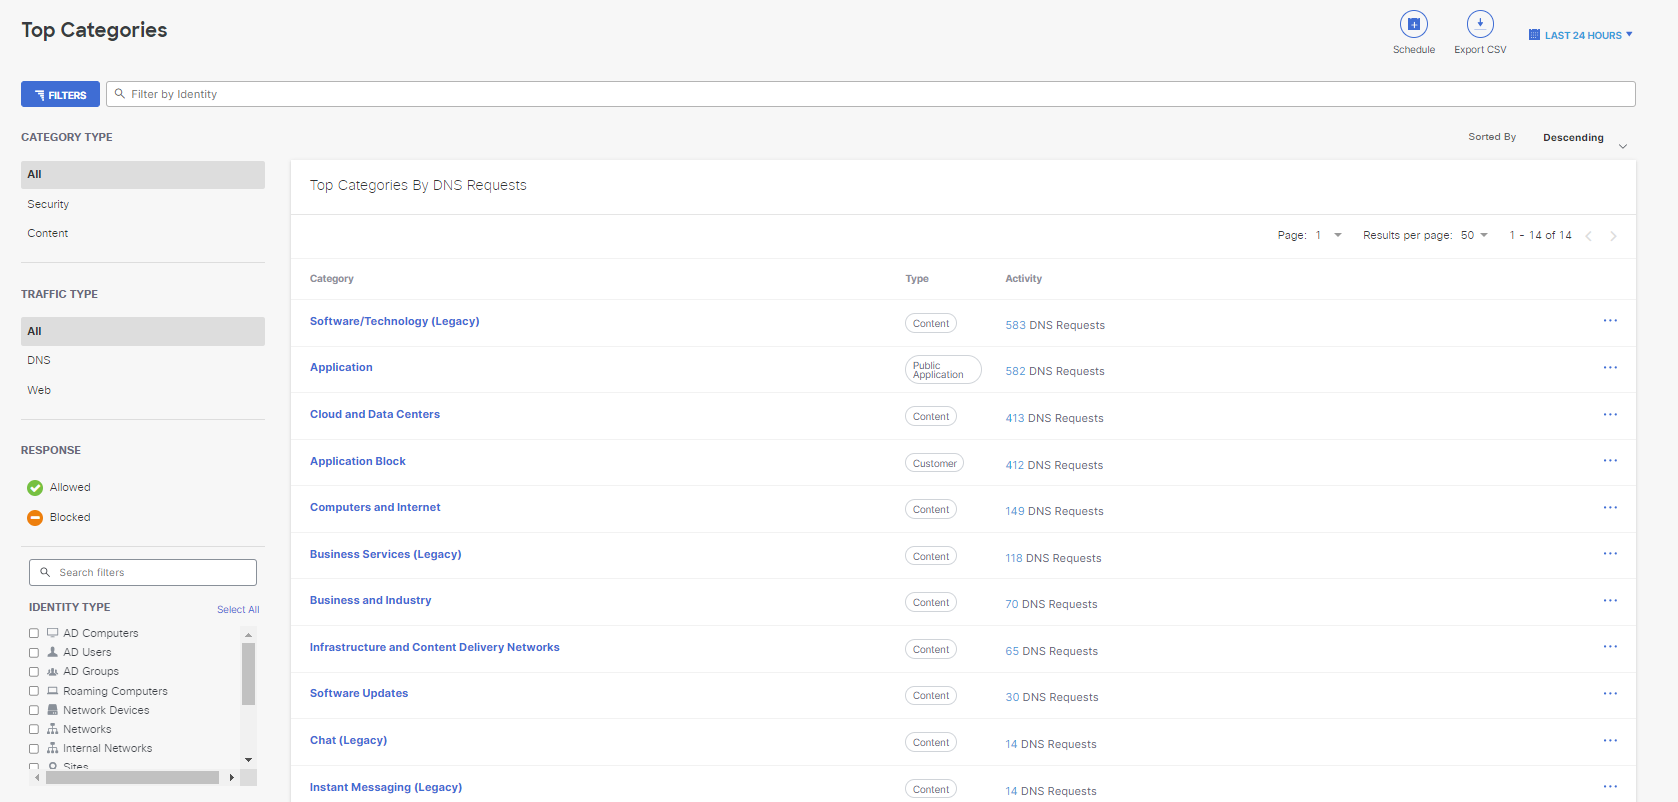
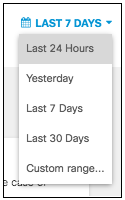
Choose a time period within which to view the results. The details can be filtered by the last 24 hours, the previous calendar day (yesterday), the last seven days, the last 30 days, or a custom range within the last 30 days.
View a Category's Traffic
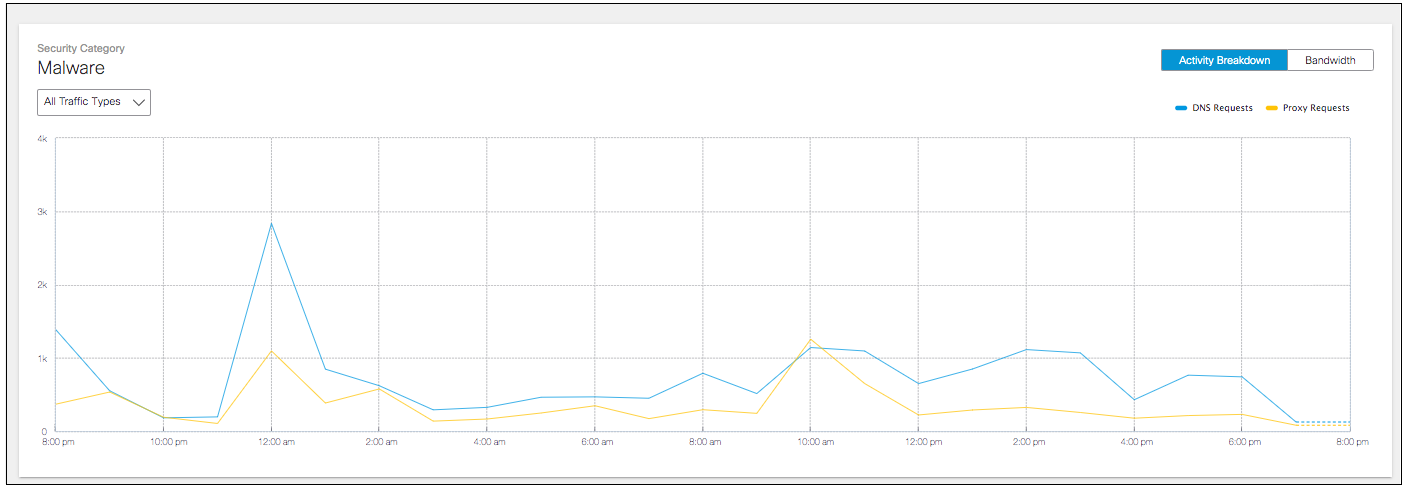
The first graph depicts the traffic over a selected time period for this category.
View the Activity Breakdown
- Click a category and navigate to the traffic graph on the details page. Select Activity Breakdown.
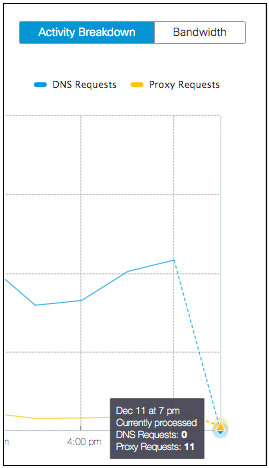
The Activity Breakdown displays the number of DNS requests and proxy transactions for the selected time period.
- Filter the Activity Breakdown to view All Traffic Types (default), DNS, Web, or Firewall.
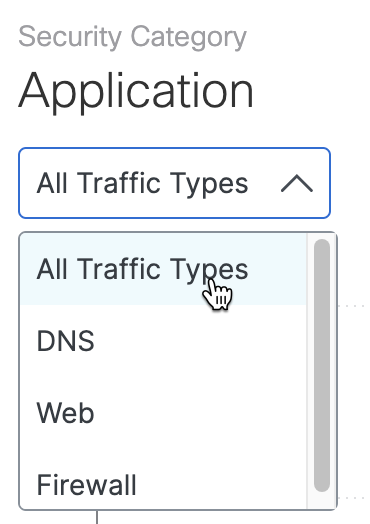
You can also choose the traffic type to filter before redirecting to the category details from the Top Category report. IP requests are not an option in Category Details.

- Hover over a date and time to reveal details about the requests made at that time.
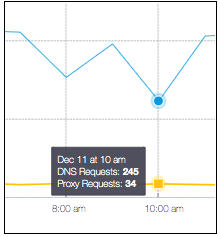
The dotted line provides available data that is still being processed. Hover over the point on the graph to see how many requests are currently processed.
View the Traffic Bandwidth
- Click a category and navigate to the traffic graph on the details page. Select Bandwidth.
For proxy transactions, the bandwidth view of the line graph shows the number of inbound and outbound traffic for the selected time period.
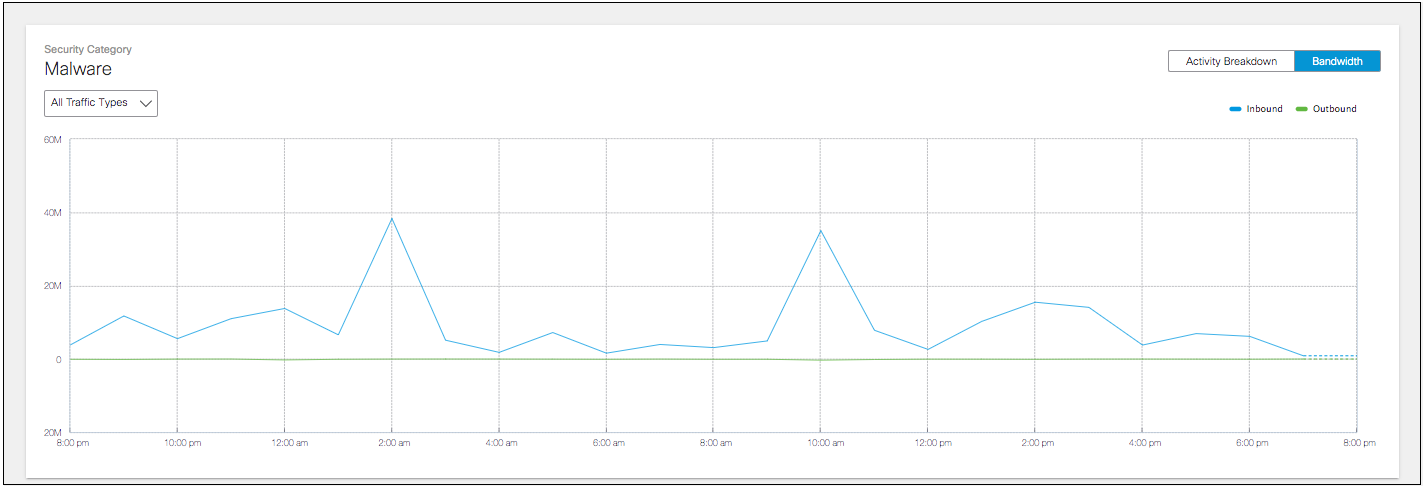
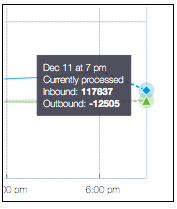
- Hover over a specific date and time to reveal details about the traffic at that time.
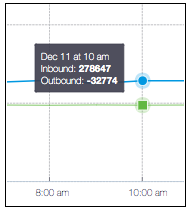
The dotted line provides available data that is still being processed. Hover over the point along the graph to see the inbound and outbound traffic details currently processed.
View a Category's Identities
- Navigate to the identities section of the report.
- View the Identities Traffic Distribution.
The pie chart provides a breakdown of the identity types that have made requests for the category for the selected time period. - View the top identities making requests associated with this category.
- Identity—The name of the identity.
- Requests—The number of category requests the identity has made during the selected period.

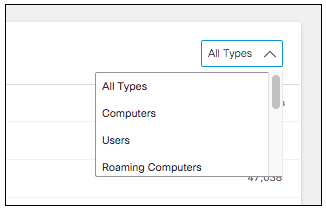
You can filter which identity types are listed by selecting an identity type from the drop-down.
View the Category's Top Domains
- Navigate to the Top Domains section of the report.
This list depicts the top domains where requests were flagged for this category:
- Domain Name—The domain name, such as example.com.
- Other Categories—If there are other categories associated with the domain in addition to the current category being viewed, they are listed here.
- Allowed—The number of requests allowed for this domain for the selected time period.
- Blocked—The number of requests blocked for this domain for the selected time period.
- Requests—The number of requests made for this domain for the selected period.

Click a domain to open the Destination Details. Click View Full List to open the Top Destinations Report filtered by this category.
Top Categories Report < Category Details > Third-Party Apps Report
Updated 10 months ago
