Destination Details
The Destination Details report provides access to information about the destinations that your identities are visiting, determining which are the most actively requested and when this activity occurs. Here you can explore activity at the domain level, determining who has visited the selected domain and when. This detailed information can help you determine if any computer or networks may be compromised or are connecting to known malicious sites so that you can better protect yourself and others.
Table of Contents
- Prerequisites
- View the Destination Details
- View the Request Traffic
- View the Access and Policy Details
- View Recent Activity
- View the Most Visited URL Paths
Prerequisites
- A minimum user role of Read-only. For more information, see Manage Accounts.
View the Destination Details
- Navigate to Monitor > Reports > Top Destinations and click a Destination

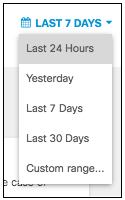
- Choose a time frame within which data is displayed.
- View the destination's content and threat categories.
At the top of the report, under the domain for the destination you are viewing, are any categories associated with the destination. For category definitions, see Manage Content Categories and Manage Threat Categories.

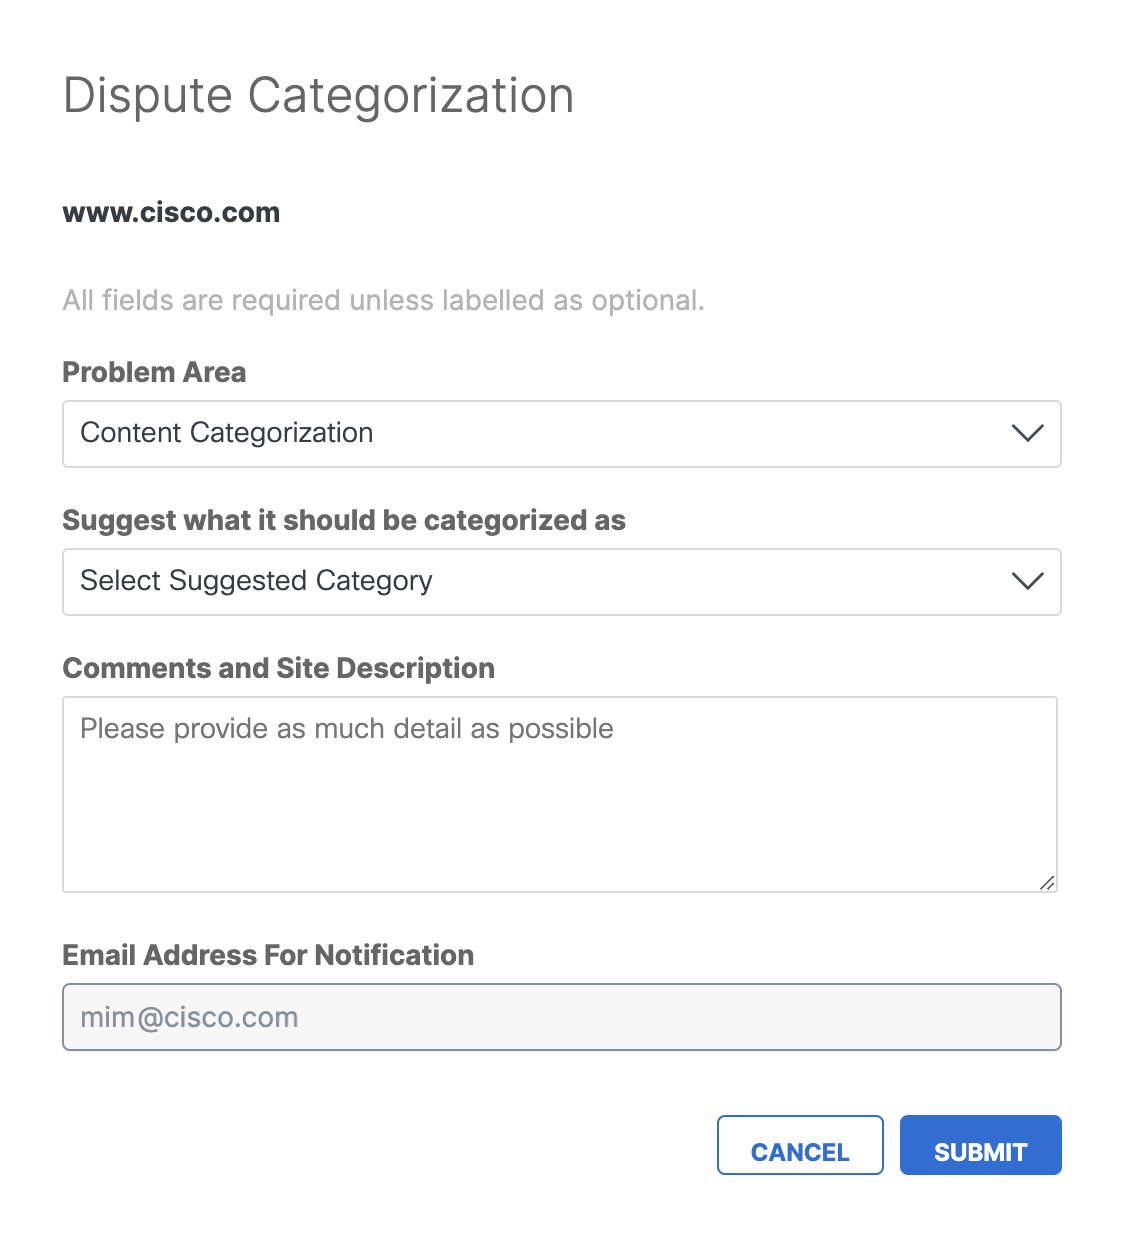
If you believe this destination belongs in a security category, click Suggest Security Categorization, fill out the request form that creates an internal Secure Access ticket for a security researcher to review, and click Submit.
View the Request Traffic
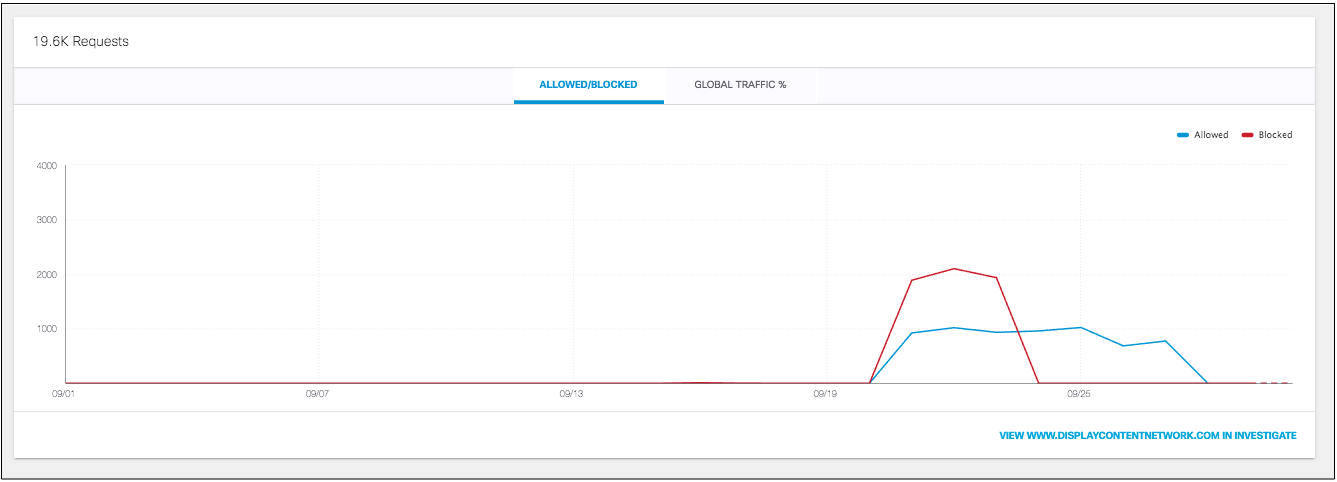
The traffic graph displays the traffic for the type selected (blocked, allowed, or both) within the selected time period. This enables you to visualize when there are more active requests for this destination and if these requests are allowed or blocked.
View Requests by Blocked or Allowed
- Click on Allowed, Blocked, or both to view those requests in the traffic graph.
The graph displays the number of blocked and allowed requests for the destination that you are viewing within the selected time period. You can choose to see both Allowed and Blocked requests or one or the other individually. By default, only Allowed are shown initially.

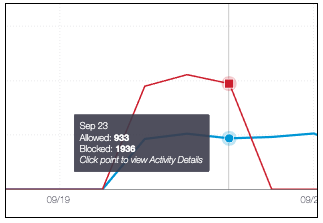
- Hover over a point on the graph to reveal the date and time and the number of Blocked and Allowed requests at that point.
Clicking the point will redirect you to the Activity Search Report filtered by this domain and the Response (Blocked or Allowed) selected.
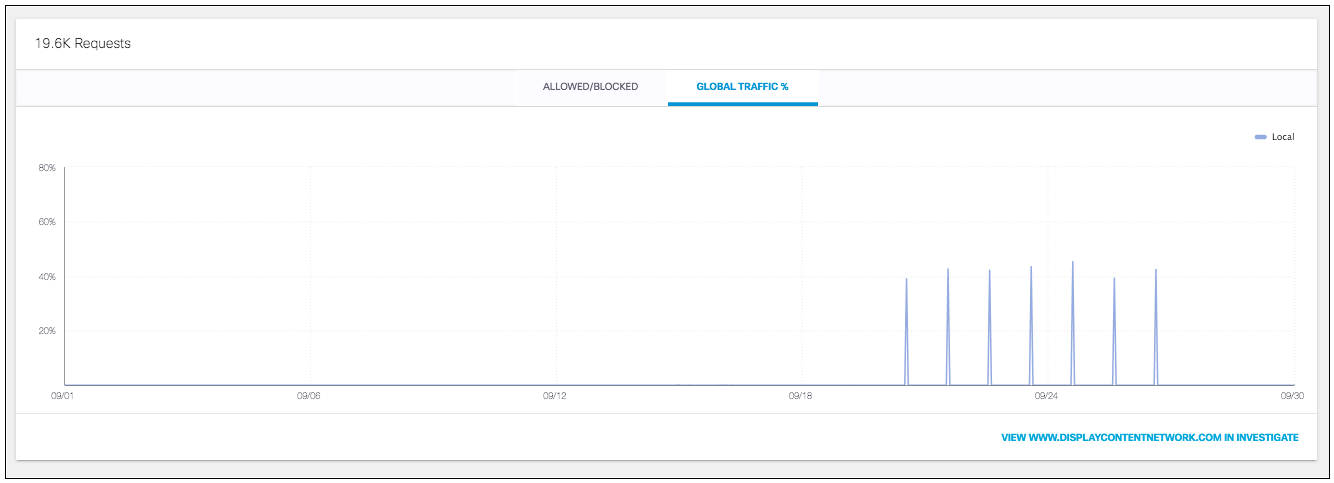
View Requests Through Global Traffic %
- Click Global Traffic % on the traffic graph.
The Global Traffic % chart displays the percentage of global traffic to this specific destination that is comprised of local traffic from your organization’s Identities.
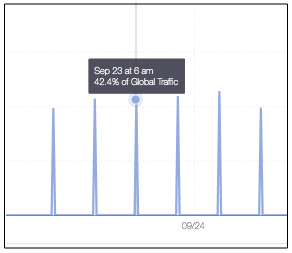
- Hover on a point to view the date, time, and percentage of global traffic at that time.
View the Access and Policy Details
The Access and Policy Details presents information related to identities accessing the destination and if the destination belongs to any Destination List policies.

- Navigate to the Access & Policy Details > Top Identities.
The Top Identities lists the sources that had the most requests for access to this destination. - Navigate to the Access & Policy Details > Destination Lists.
The Destination Lists table shows if this domain belongs to any Destination Lists in your rules and what effect that list would have on the domain.

View Recent Activity
The Recent Activity chart lets you investigate DNS activity for this destination. You can view the identities that requested the destination, the action (response) to that request (Blocked or Allowed), the external and internal IP addresses, and the date and time of the request. Viewing this information enables you to make decisions about how to best maintain your destination lists. Click View All Activity to open the Activity Search Report filtered by this domain.

View the Most Visited URL Paths
This chart lists the most frequently visited URL paths for this domain and the number of requests for each path within the requested time period.

Top Destinations Report < Destination Details > Top Categories Report
Updated over 1 year ago
