View Summary of Endpoints
View a real-time summary of the health of your endpoints for faster troubleshooting and to take action to deliver a better, more secure experience for your end users.
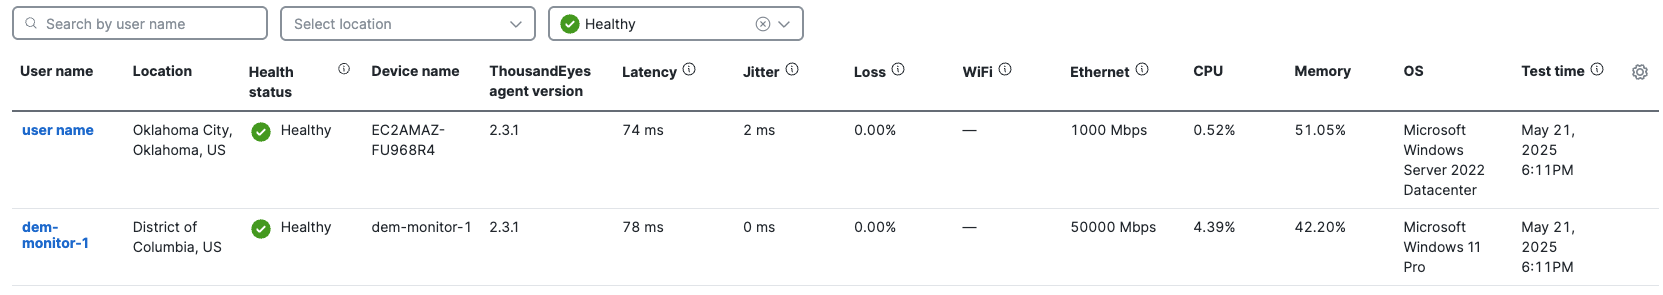
- Navigate to: Experience Insights > Insights Management > Management.
- Use the search and filter options to review endpoint table results by user name, location, or health status. Search using multiple criteria is not supported (for example, you cannot search by location AND health status).
- The ThousandEyes endpoint agent leverages the Npcap driver library to collect metrics on Windows devices. A warning icon in the endpoint table Device name field indicates a Windows device with an Npcap version that is unsupported by ThousandEyes. ThousandEyes will not collect metrics from Windows devices with unsupported versions.
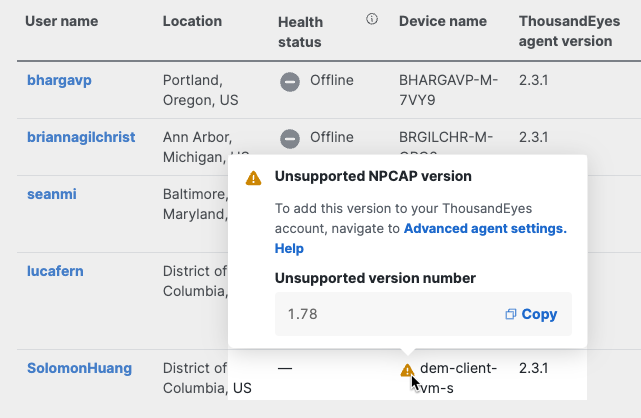
To enable unsupported versions of Npcap, navigate to Advanced agent settings in ThousandEyes. For more information, see Npcap Driver Upgrade Management in ThousandEyes documentation.
Endpoint Health Status
Experience Insights assigns a summary Health Status to each endpoint in the table and on the endpoint performance map. For more information, see View Endpoint Performance Map.
Health Status of an endpoint three endpoint metrics and three network metrics. These thresholds determine the health status of each metric:
Endpoint thresholds
| Metric | |||
|---|---|---|---|
| CPU | <80 | 80 < value < 95 | >95 |
| Memory | <80 | 80 < value < 95 | >95 |
| Wi-Fi signal | >40 | 40 > value > 20 | <20 |
Network thresholds
| Metric | |||
|---|---|---|---|
| Jitter | <30 | 30 < value < 40 | >40 |
| Packet loss | <10 | 10 < value < 20 | >20 |
| Average latency | <100 | 100 < value < 150 | >150 |
Experience Insights calculates endpoint health status as follows:
 Healthy when all six metrics are in the healthy threshold.
 At Risk when at least one of the six metrics is at risk.
  Unhealthy:
- When Wi-Fi signal is in the unhealthy threshold.
- Or, when all three network metrics are in the unhealthy threshold: Jitter, Packet loss, Average latency.
Note: If an endpoint's CPU or Memory metric is in the unhealthy threshold when others are not, summary Health Status will be at risk, not unhealthy.
View Endpoint Performance Map < View Summary of Endpoints > Wi-Fi Descriptions
Updated about 1 month ago