Total Requests Report
The Total Requests report displays traffic for a user-specified time period. View traffic trends using categories, traffic type, and responses.
Prerequisites
- A minimum user role of Read-only. For more information, see Manage Accounts.
Procedure
- Navigate to Monitor > Reports > Total Requests.
-
Filter the report using the following options:
- In the Last 24 Hours menu, select a time frame for the report.
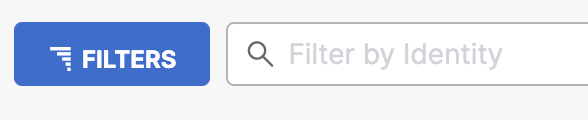
- To search for a specific identity, use the search bar.
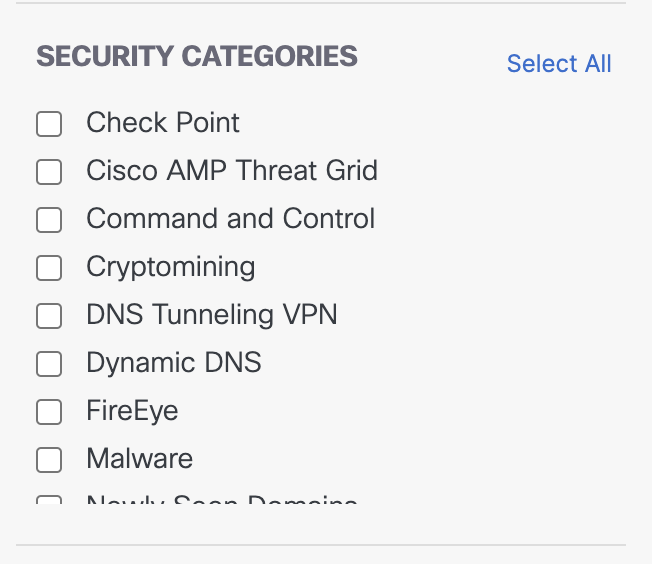
- Filter by security category.
- For more information about threat categories, see Manage Threat Categories and Threat Category Descriptions.
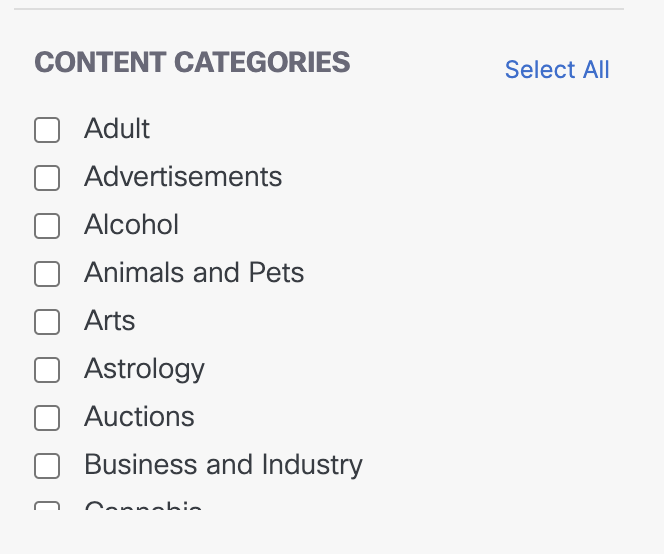
- Filter by content category. For the full list of content categories, see Available Content Categories.
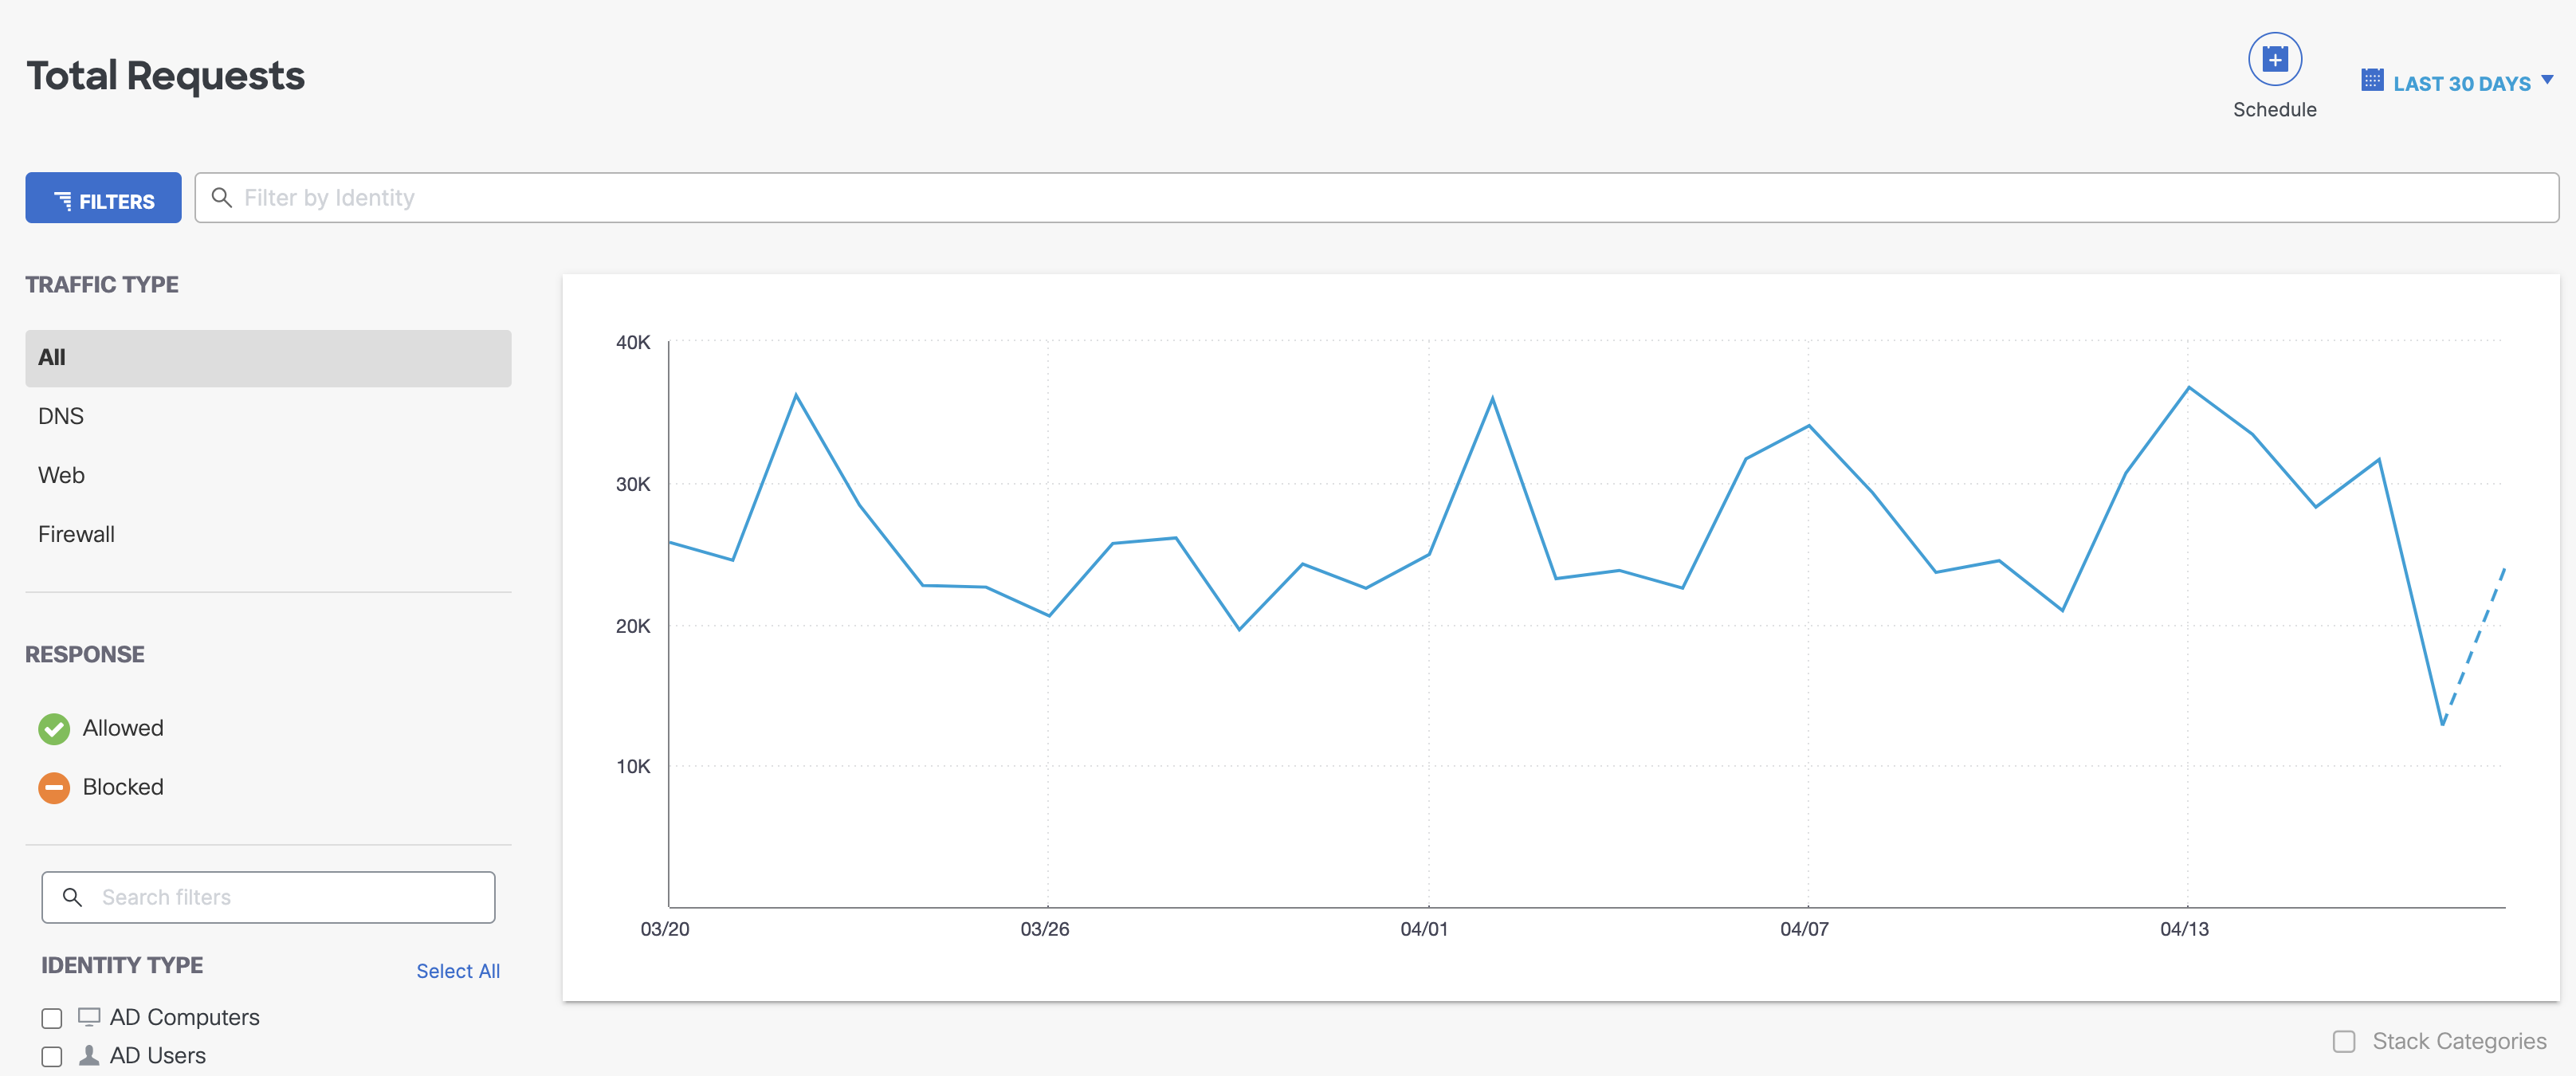
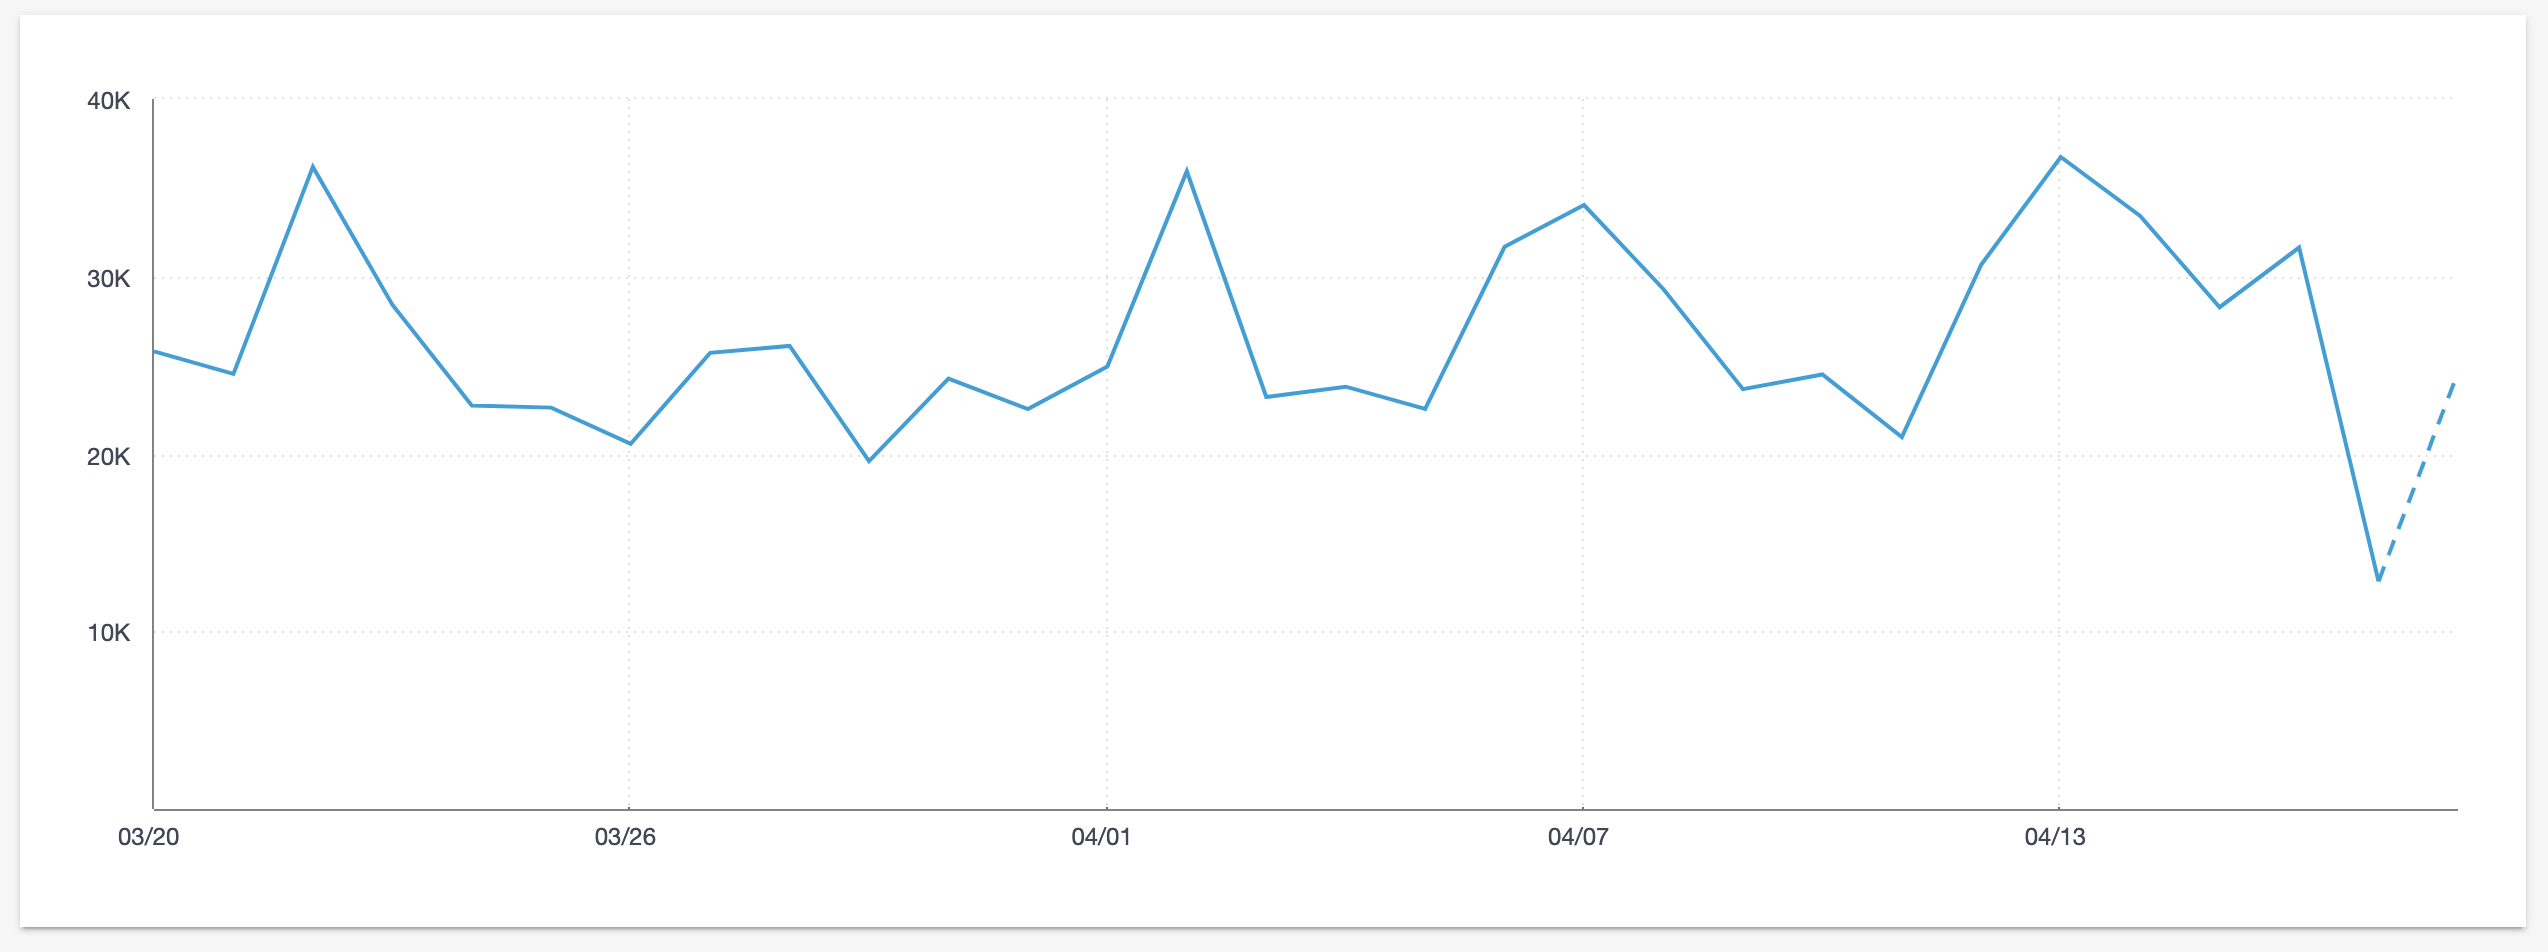
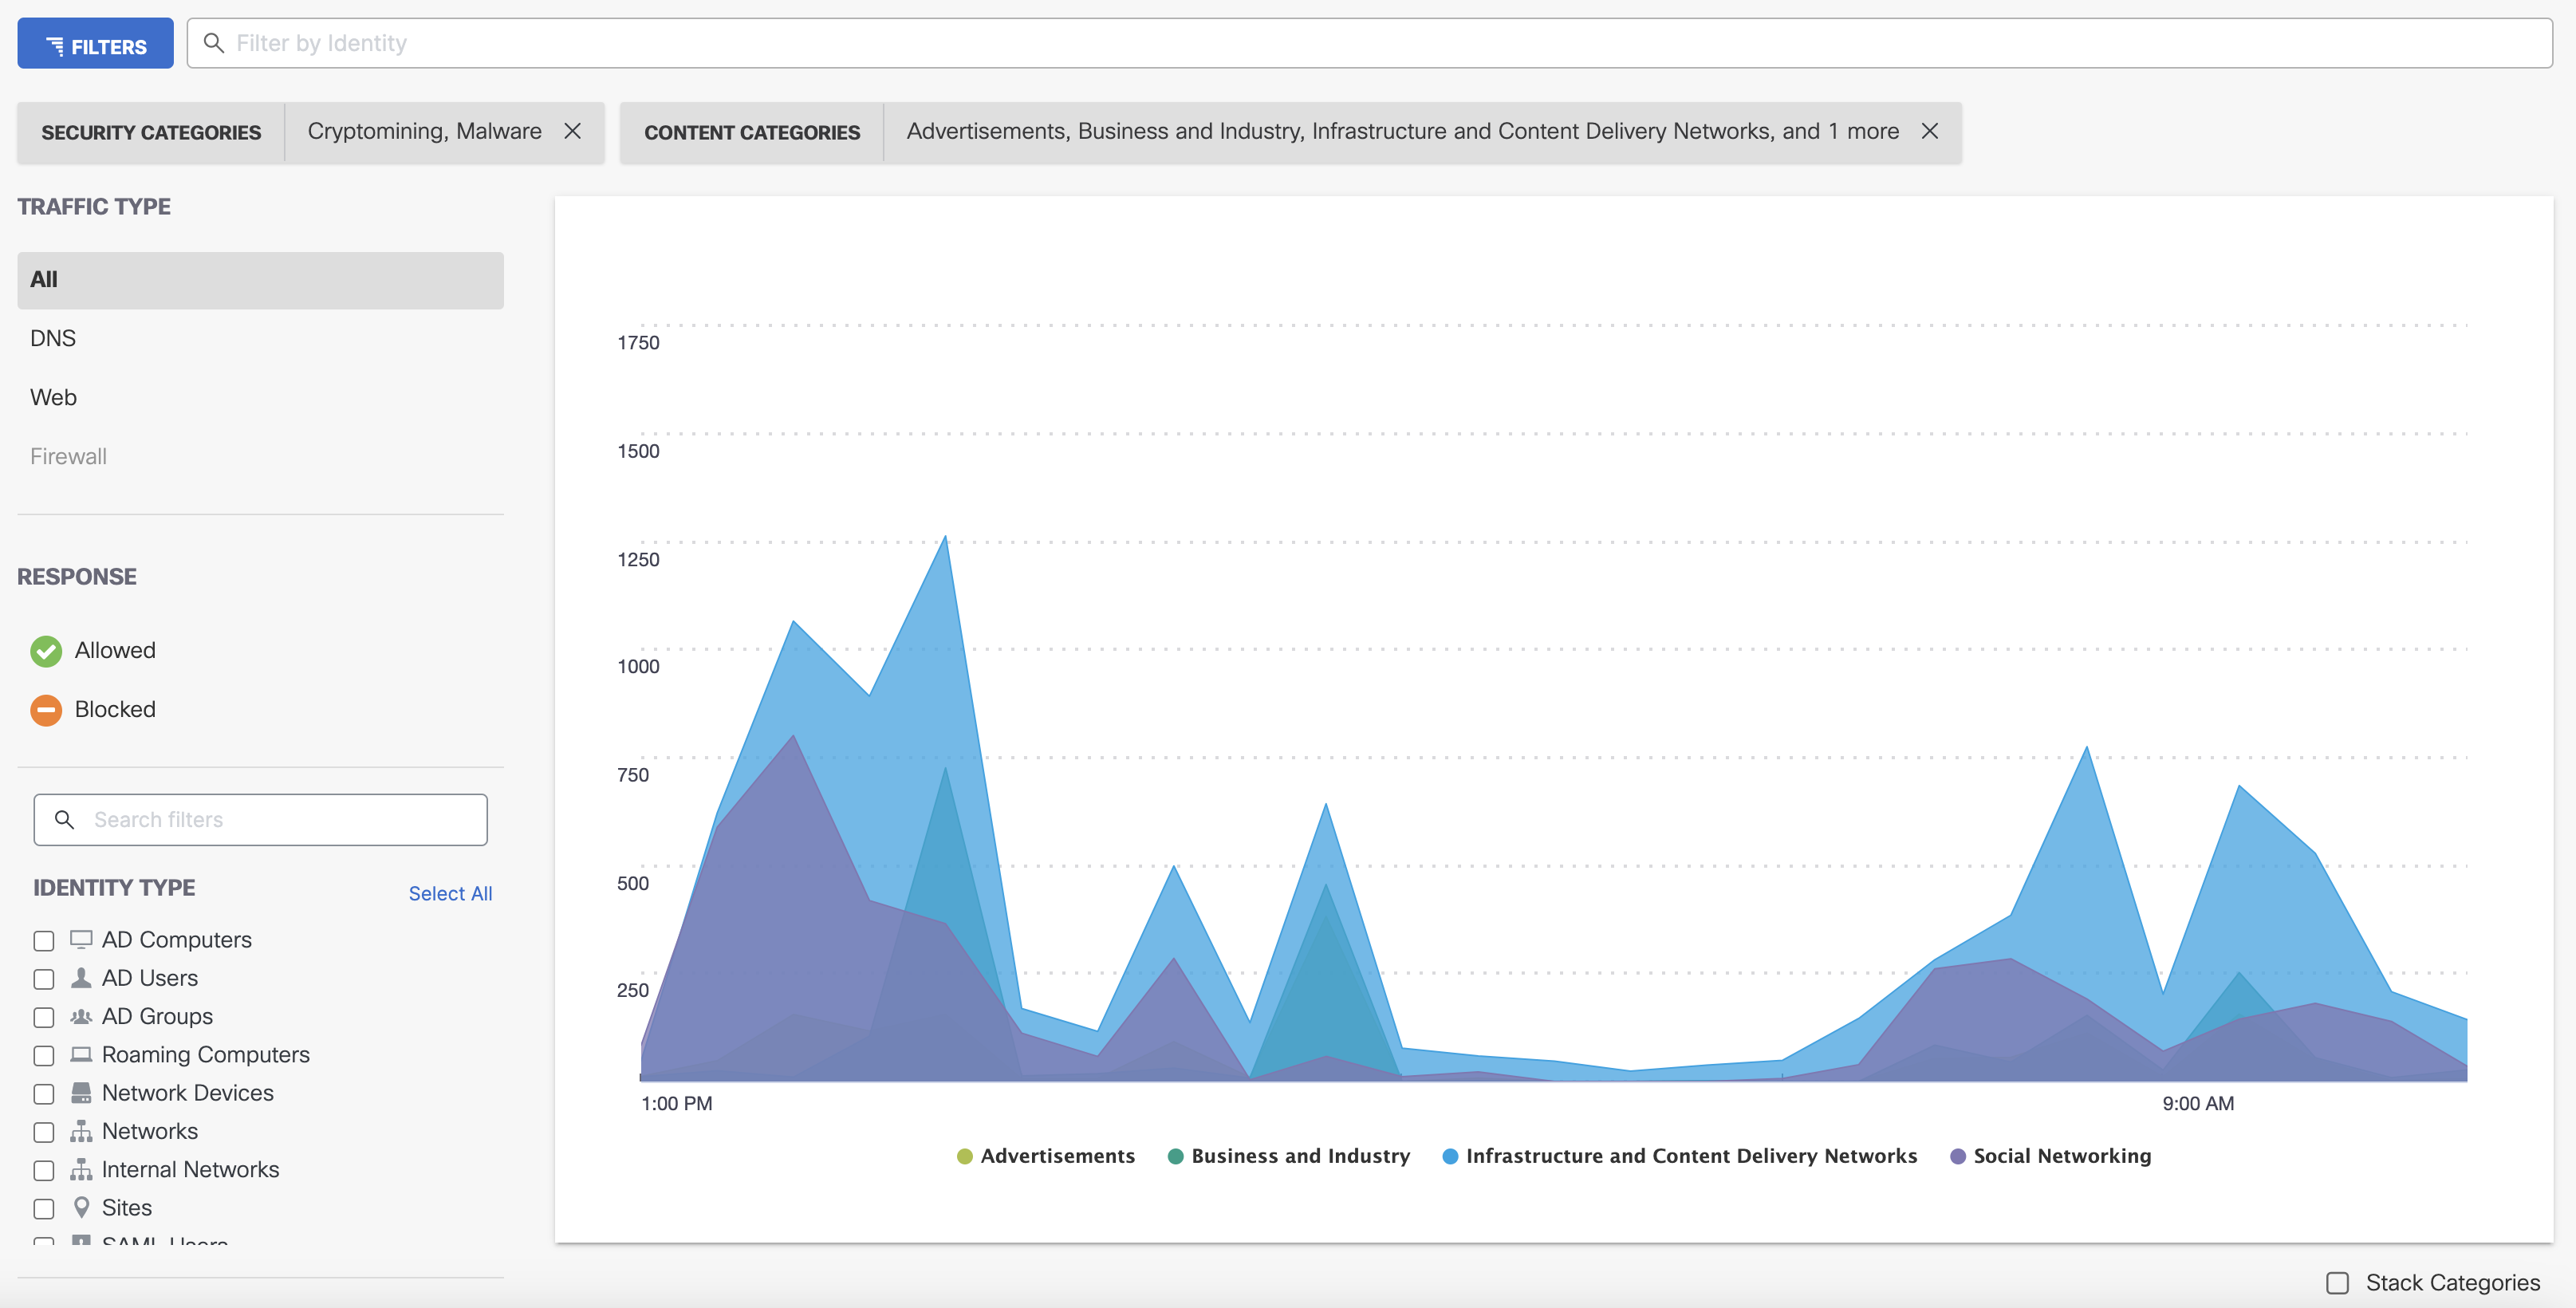
Result: The trend graph updates with the total request data. If no security or content categories are selected, the graph displays a line that reflects the time frame, responses, and identity types selected.
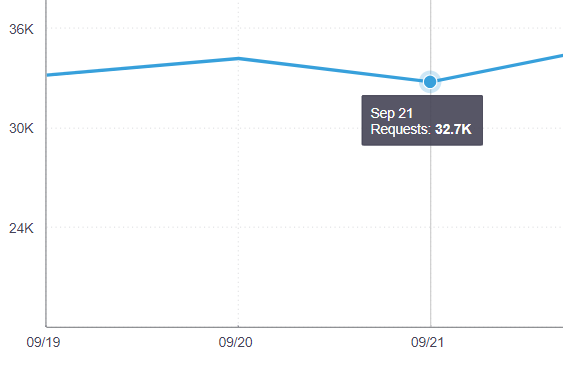
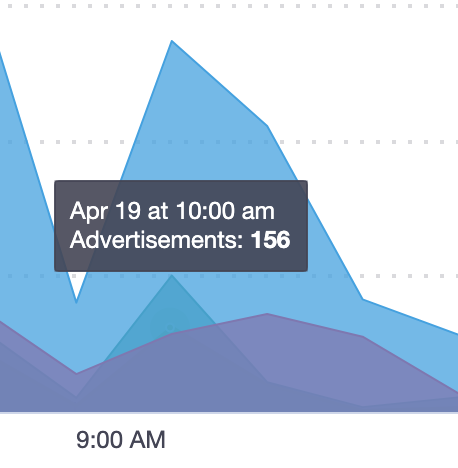
Hover on a point on the graph to show the date and number of requests for the timestamp.
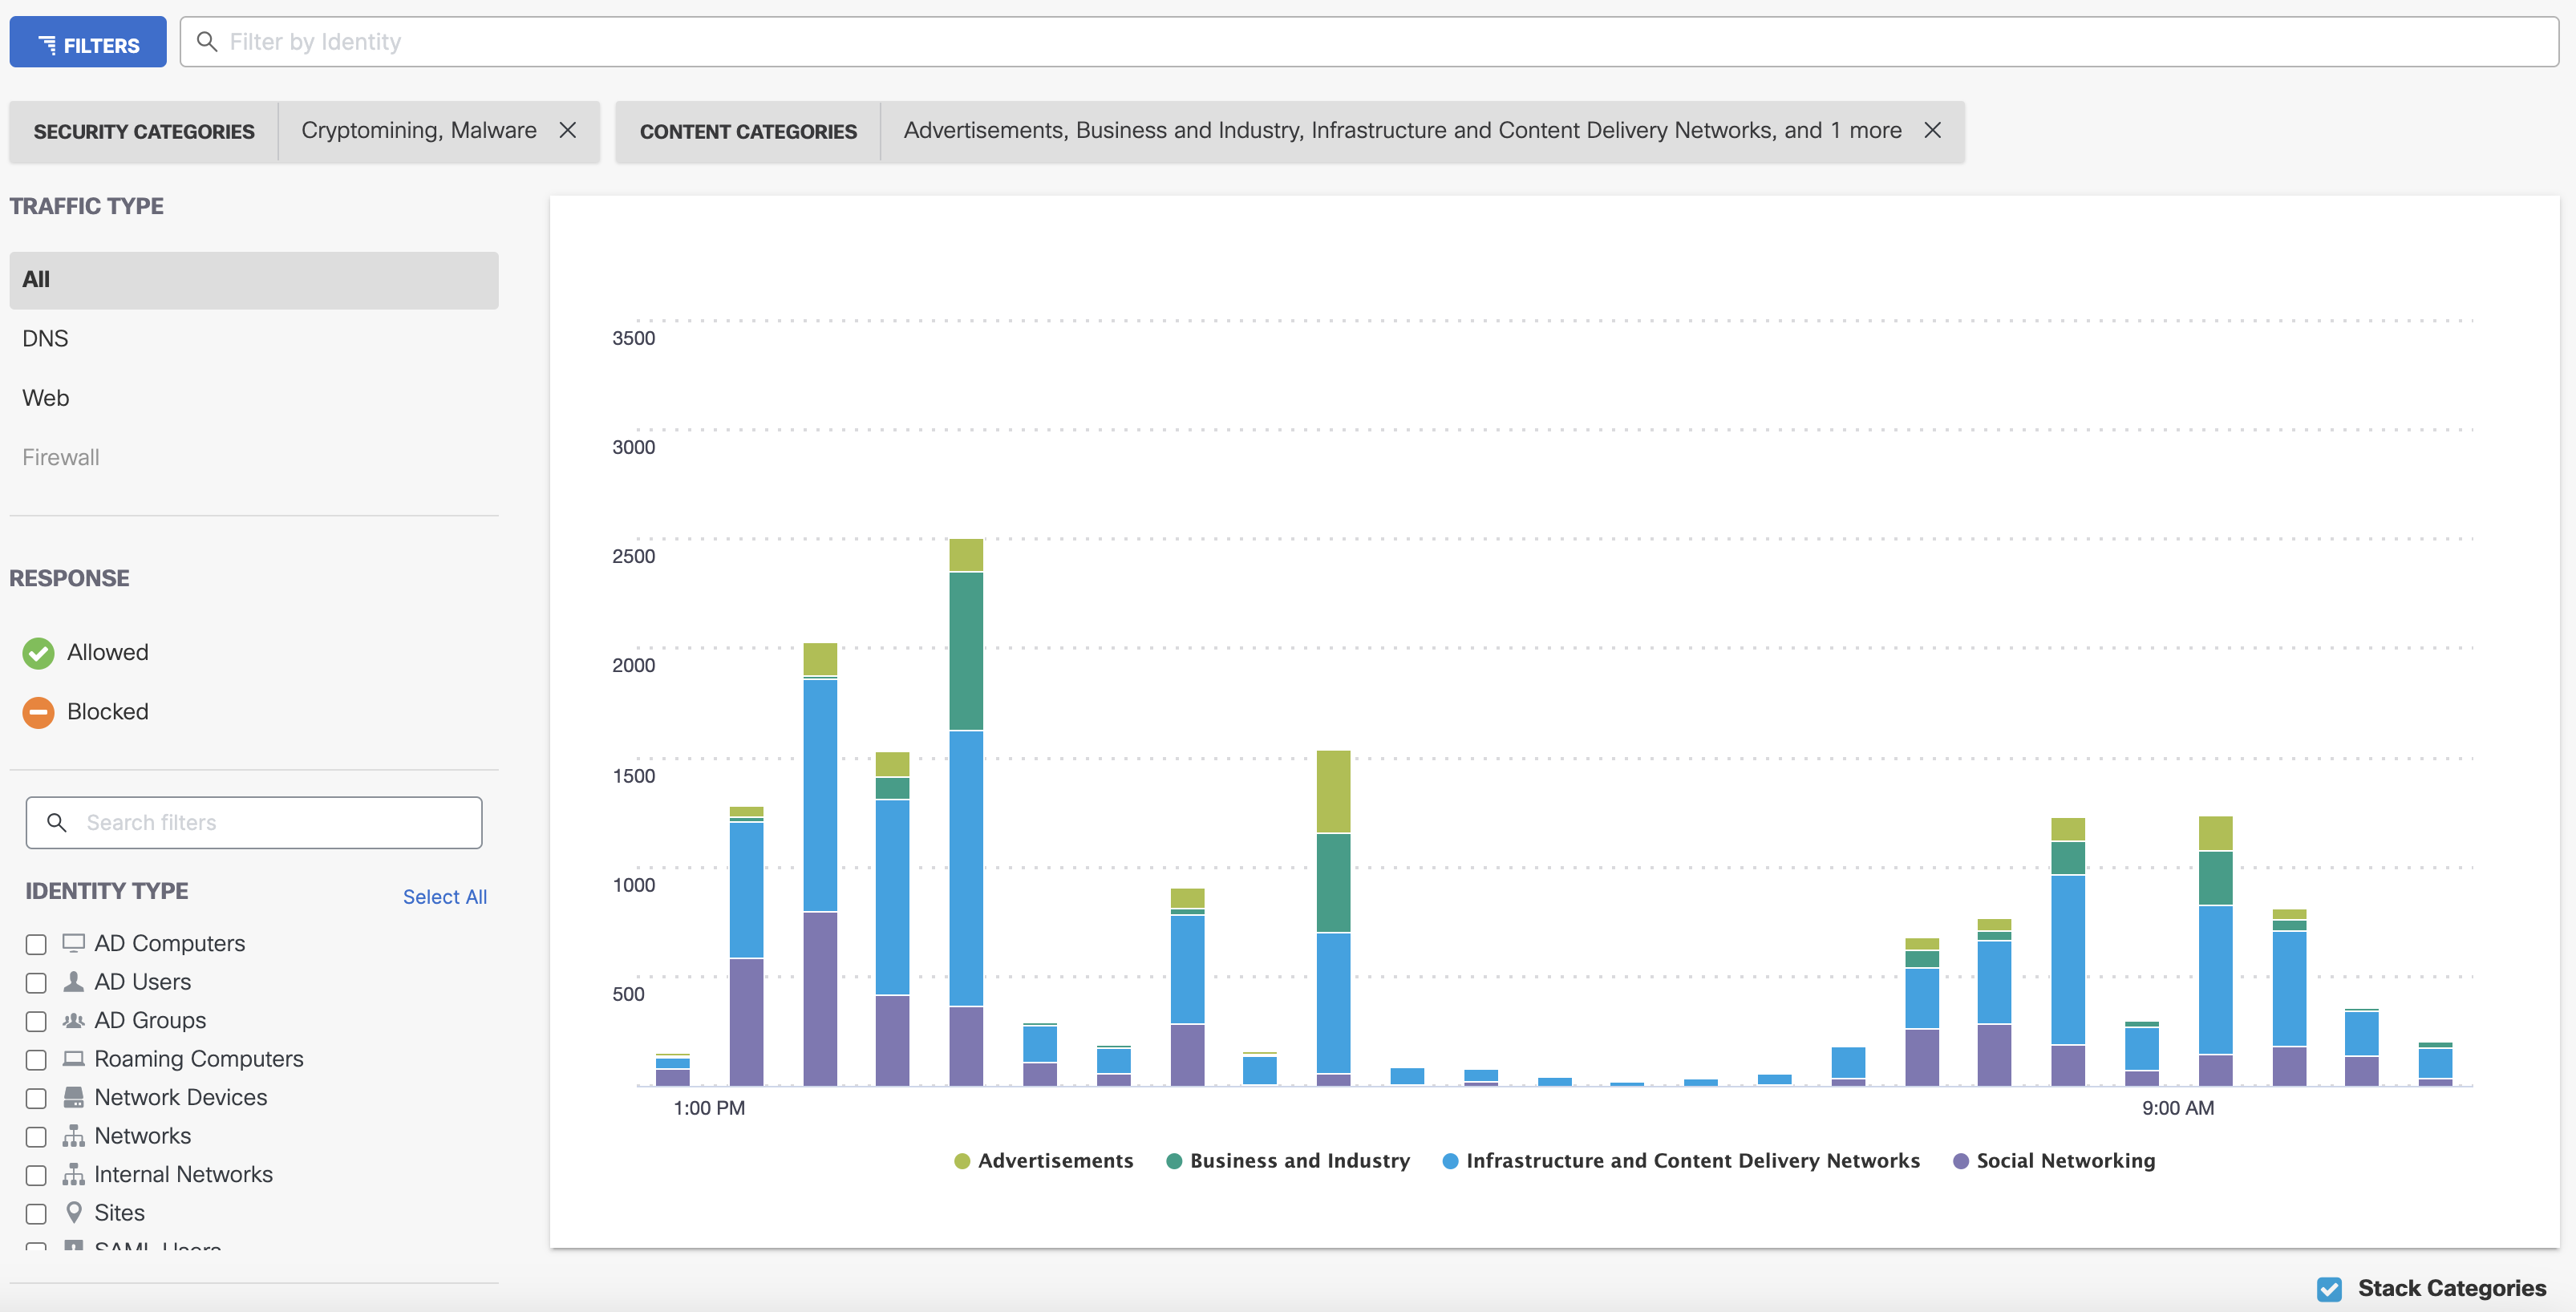
When you filter by security or content categories, a bar graph displays. If multiple categories show traffic for the dates, you can stack the categories by clicking the Stack Categories checkbox.
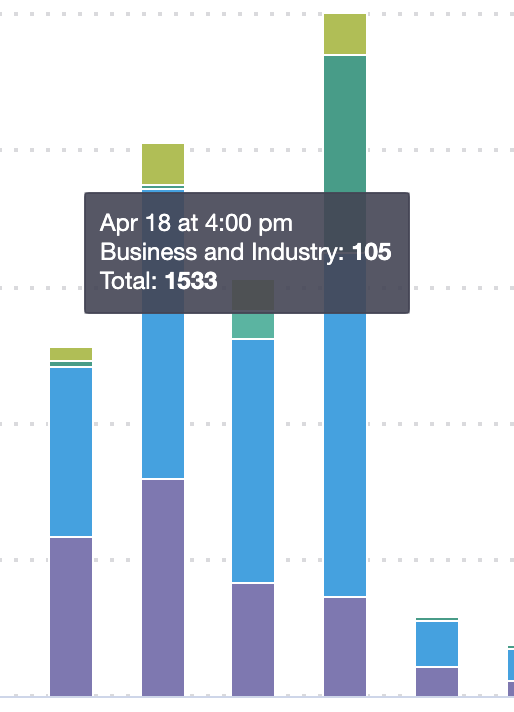
Hover on a category to view its specific date and time, total requests for the category, and overall total requests for the timestamp.
To view the categories unstacked, uncheck the Stack Categories checkbox.
Hover on a point on the graph to view the total requests for the category at that time.
Click a category on either graph type to redirect to the Category Details for that category.
Search for Security Activity < Total Requests Report > Activity Volume Report
Updated 6 months ago